Blog
How to Create Statistical Hypotheses in Linear Regression, Correlation Analysis, and T-test
Formulating hypotheses is a crucial step in any research activity. Researchers need to conduct a series of scientifically-based research activities to test these research hypotheses. This series of scientific activities include formulating a research proposal, presenting the proposal in a research proposal seminar to gather feedback, data collection, data analysis, and hypothesis testing to draw research conclusions.
A hypothesis is a temporary conclusion of a study that needs to be proven through research activities. The next question is how researchers test their research hypotheses. To conduct hypothesis testing, researchers can develop statistical hypotheses.
Understanding Statistical Hypotheses
Statistical hypotheses can be divided into two types: null and alternative hypotheses, written in pairs. If a researcher has written a null hypothesis (Ho), they need to articulate the corresponding alternative hypothesis (Ha or H1).
Why is it necessary to pair null and alternative hypotheses in statistical hypothesis writing? The primary reason is that we test the null hypothesis in statistical hypothesis testing. When testing the null hypothesis, two conditions can arise. We may either accept the null hypothesis or reject it. If the results of the test lead to the rejection of the null hypothesis, we will accept the alternative hypothesis.
Statistical Hypotheses to Address Research Objectives
Having understood the formulation of statistical hypotheses, I will now discuss the connection between statistical hypotheses and research objectives. It is important because statistical hypotheses are closely related to the research objectives.
Philosophically, when researchers conduct a study, there are undoubtedly specific research objectives. These research objectives are formulated based on the research questions obtained from the research problem.
Researchers need to develop research methods and data analysis techniques to address the research objectives. The formulation of research methods and data analysis techniques is carried out to test the research hypotheses. These research hypotheses can be formulated as statistical hypotheses to facilitate hypothesis testing. Each research objective can have its corresponding statistical hypothesis.

Should every research objective have a statistical hypothesis? A clear statistical hypothesis should be written if the objective involves inferential statistics. On the other hand, if the research objective focuses on descriptive statistics, then a statistical hypothesis may not be necessary to include.
How to Create Statistical Hypotheses in Linear Regression Analysis
Linear regression analysis is conducted to observe the impact of independent variables on a dependent variable. If a researcher chooses to use the multiple linear regression method, statistical hypotheses need to be formulated.
For example, a researcher examines the influence of advertising costs and the number of marketing staff on product sales. Based on this example, we can conclude that the researcher utilizes multiple linear regression.
Next, the researcher can hypothesize that advertising costs and the number of marketing staff significantly affect product sales. The research hypotheses can be written as statistical hypotheses as follows:
Ho: Advertising costs and the number of marketing staff do not significantly affect product sales.
Ha: Advertising costs and the number of marketing staff significantly affect product sales.
Additionally, the researcher can create statistical hypotheses for the partial effect of each variable as follows:
Ho: Advertising costs do not have a significant partial effect on product sales.
Ha: Advertising costs have a significant partial effect on product sales.
Ho: The number of marketing staff does not have a significant partial effect on product sales.
Ha: The number of marketing staff has a significant partial effect on product sales.
Researchers can use notation to express statistical hypotheses in linear regression analysis following the general form found in statistical books. Typically, the notation used for statistical hypotheses in regression analysis involves beta (β).
How to Create Statistical Hypotheses in Correlation Analysis
Correlation analysis is conducted to test the relationship between variables. In correlation analysis, the association test is bidirectional. For example, if X is related to Y, it can be said that Y is also related to X. This is different from linear regression analysis, where if X influences Y, it does not necessarily mean that Y also influences X.
Correlation analysis can be divided into partial correlation analysis and multiple correlation analysis. Partial correlation analysis is the most commonly used method by researchers. For instance, suppose a researcher conducts a study to determine the relationship between competency and business performance.
The researcher can hypothesize that competency has a significant relationship with business performance. The statistical notation often used in correlation analysis involves rho (ρ). The research hypothesis can be formulated as follows:
Ho: Competency does not have a significant relationship with business performance.
H1: Competency has a significant relationship with business performance.
When conducting correlation analysis, researchers should carefully consider the direction of the relationship they want to investigate and formulate the corresponding statistical hypotheses accordingly.
How to Create Statistical Hypotheses in T-test
The t-test is a statistical test researchers use to examine the difference in means between two sample groups. The t-test can be either a paired t-test or an independent t-test.
The application of the t-test is limited to comparing two sample groups, assuming that the data is normally distributed. Furthermore, the one-way ANOVA test can test differences among more than two sample groups.
For instance, a researcher conducts a study to determine the difference in mean learning outcomes between the implementation of the old and new curricula.
The notation used to express the statistical hypotheses in the t-test involves mu (µ). The research hypotheses can be formulated as follows:
Ho: The mean learning outcomes of the old curriculum are equal to the mean learning outcomes of the new curriculum.
H1: The mean learning outcomes of the old curriculum are significantly different from the mean learning outcomes of the new curriculum.
Criteria for Testing Statistical Hypotheses
Statistical hypothesis testing can employ two criteria, both leading to the same conclusion. The first criterion for testing statistical hypotheses involves comparing the estimated value with the critical values from the F-table, T-table, or r-table.
The null hypothesis is rejected if the estimated value is higher than the critical value. Conversely, the null hypothesis is accepted if the estimated value is lower than the critical value.
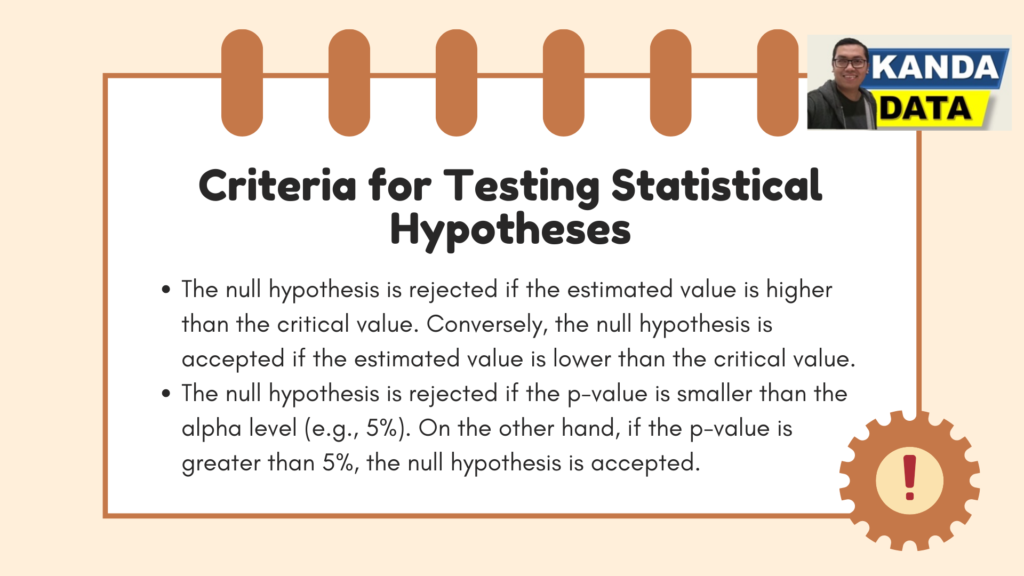
The second criterion for testing statistical hypotheses is the probability value (p-value) compared to the chosen alpha level. The null hypothesis is rejected if the p-value is smaller than the alpha level (e.g., 5%). On the other hand, if the p-value is greater than 5%, the null hypothesis is accepted.
As discussed above, it can be concluded that hypotheses play a crucial role in research. Research hypotheses are tested through a series of research activities following scientific principles.
Research hypotheses can be formulated as statistical hypotheses and then tested to accept or reject the null hypothesis. If the statistical hypothesis testing leads to rejecting the null hypothesis, the alternative hypothesis will be accepted.
Formulating statistical hypotheses in association tests, such as linear regression analysis, correlation analysis, and t-tests, may differ slightly. However, the fundamental principle remains the same: statistical hypothesis testing is performed to examine the null hypothesis.
Researchers can choose one of the existing criteria for hypothesis testing. They can either compare the estimated value with critical values or look at the probability value (p-value) compared to the alpha level. The results of hypothesis testing will be used to answer the research objectives. Therefore, researchers need to have sufficient knowledge of statistical hypotheses.
It is the article that Kanda Data can write on this occasion. I hope it will be helpful and add value to those in need. Stay tuned for educational article updates from Kanda Data next week. Thank you.