Blog
How to determine the minimum sample size to be representative

Based on the type, research can be divided into survey research and experimental research. In survey research, we generally collect primary data from a population. Researchers can take population data or samples from the population in the study.
The population is the entire research subject or quantitative and qualitative variables on the problem under study. A population can also be interpreted in the research area that will be observed for generalization. Researchers who observe a population would be better off if they took all population members. However, collecting data from all population members requires high costs and labour and takes a long time.
Therefore, researchers need a method with more affordable costs, labour, and time efficiency, but the results still represent the observed population. This method is called the sampling technique. The sample is part of the research object taken from the whole object under study.
Sampling technique
Sampling techniques need to be a concern for researchers before taking data in the field. The correct sampling technique will represent the observed population so that the generalization of research results from the samples can be justified scientifically.
Sampling techniques can be divided into probability sampling and non-probability sampling. The probability sampling technique provides an equal opportunity for each member of the population to be selected as a sample. In contrast, the non-probability sampling technique does not provide equal opportunities for each member of the population to be the research sample.
On this occasion, Kanda Data will focus on discussing probability sampling. In the probability sampling technique, there are several methods, including simple random sampling, stratified random sampling, proportional random sampling, etc.
Terms of simple random sampling
Simple random sampling can take a sample from the population if it meets the minimum requirements. The first requirement is the availability of a sample frame from the observed population. In this case, the researcher already has information on the number of populations, population characteristics, and data on the names of population members.
The second requirement for using simple random sampling is that members of the population of characteristics are homogeneous. If the two minimum requirements are met, the sample frame is available, and the data is homogeneous, the researcher can use a simple random sampling technique.
Random sampling of members of the population is intended to provide equal opportunities for each member to be selected as a sample. Homogeneous members of the population allow the researcher to take a random sample. The next question is, how many the minimum sample to be able to represent the observed population?
Determination of sample size
The sample size is an important thing that researchers must understand. There are two considerations when determining the sample to be representative: the consideration of cost, labour and time and the consideration of the minimum sample size. Regarding the importance of this topic, Kanda Data takes this opportunity to write how to determine the minimum sample size to be representative.
Determining the minimum sample size to be representative, one of which can use the Slovin formula. Using the Slovin formula, the population must be known and the population data homogeneous. Slovin’s formula can be seen as follows:
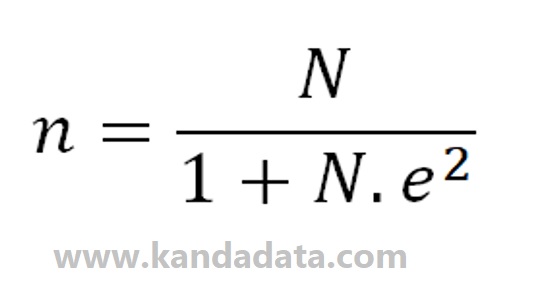
Information
n = sample size
N = population size
e = margin of error
Example of sampling technique with slovin formula
The slovin formula can be used when the researcher uses simple random sampling. Following what I wrote earlier, the slovin formula can be used to determine the minimum sample size to be representative.
For example, there is a researcher who is observing consumer behaviour. The researcher already has data on the number of consumers, as many as 1000 people. The researcher has confirmed that the 1000 people’s data is homogeneous.
Based on the case study, as many as 1000 consumers are called the population. Furthermore, the researcher assumes that the population data cannot be fully controlled, so the researcher sets a margin of error of 10%.
We can calculate the minimum number of samples using the Slovin formula. Based on the data obtained, it is known that the population size is 1000 people, and the margin of error is 10%. Next, we calculate using the Slovin formula as follows:
N = population size = 1000 consumers
e = margin of error = 0.10
n = N/(1+N*e^2)
n = 1000/(1+1000*0.10^2)
n = 90.91
n = 91 consumers
How to choose a sample randomly
Based on Slovin’s formula, we found the minimum number of samples representing the observed population. Does the number of samples have to match the Slovin formula’s calculation results?
Following what I wrote in the previous paragraph, the slovin formula can be used by researchers to determine the minimum sample size. Therefore, it is better if the researcher wants to increase the number of samples larger than the minimum number of samples.
The larger the number of samples taken, the more representative the observed population. However, if you use a simple random sampling technique, it must be taken at random. Each member of the population has an equal chance of being selected as a sample.
Furthermore, how do we choose a random sample after we have determined the number of samples to be taken? How choose a sample randomly can be done in several ways. You can use a random table, or you can use software to help with sampling.
Even a random sample using Excel can also be done easily. You can use the data analysis toolpak menu to select a random sample. You can also create a random formula in Excel to determine the number of samples selected from the population.
Based on the calculations using the Slovin formula, the number of samples to be taken is 91 consumers. Then you can choose a sample randomly using Excel. On another occasion, I will give a tutorial on How to choose a random sample using Excel.
For a comprehensive guide to determining sample sizes and designing robust research studies, I highly recommend the book Research Design: Qualitative, Quantitative, and Mixed Methods Approaches. This essential resource provides practical insights for selecting the appropriate methods and ensuring representative sampling.
That’s all I can write on this occasion. Hopefully, the minimal sampling technique to represent this population can be useful for all of you. Wait for the update of the Kanda data article next week!