
In regression analysis, both simple linear regression and multiple linear regression, it is necessary to conduct an analysis of variance calculation to find the statistical F value. The table for the analysis of variance in the regression analysis is called the ANOVA table.
In the ANOVA table, there are several calculation formulas that are related to one another. In order to figure out the value of the F statistic in the regression analysis, you have to do calculations in a logical order.
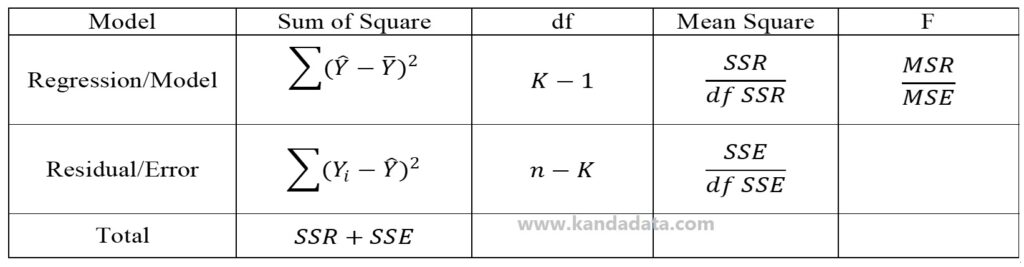
Several calculation formulas in the ANOVA table consist of the sum of squares, degrees of freedom, mean square, and F-statistics. Because it is important to understand how to calculate the ANOVA table, Kanda Data will discuss the formula for calculating the Analysis of Variance (ANOVA) table in multiple linear regression.
Sum of Square Formula
The ANOVA table consists of a regression model and a residual model. Therefore, the sum of squares is calculated for both models.
It is necessary to calculate the predicted value of the dependent variable and the average value of the dependent variable to calculate the sum of squares. Therefore, it is necessary to calculate the value of the estimated regression coefficient first. To calculate the regression estimation coefficient, you can read the previous article entitled: “Finding Coefficients bo, b1, b2, and R Squared Manually in Multiple Linear Regression.“
After obtaining the estimated regression coefficient value, the next step is calculating the dependent variable’s predicted value. Using the results of these calculations, it can be used as a part of the formulas for calculating sum of square regression and sum of square residual.
In detail, the sum of squares calculation formula and an example of the calculated data can be seen in the image below:
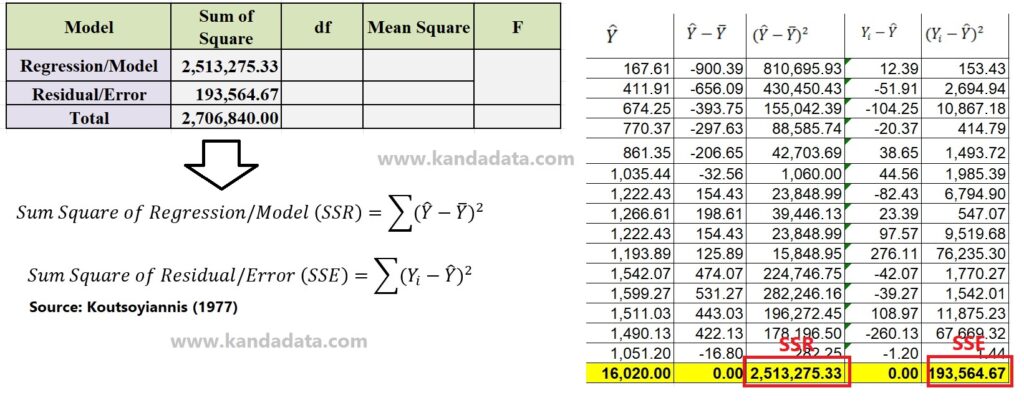
Based on the picture above, it is very clear that the predicted value of the dependent variable and the average value of the dependent variable are needed to calculate the sum of squares. Based on the calculation results, the sum of squares regression value is 2,513,275,33.
Furthermore, the calculation of the sum of square residuals is also very clear, which is done by squaring the residual value for each observation. Based on the sum results, the residual sum of squares is 193,564.67.
To calculate the total sum of squares, it is done by adding up the sum of square regression values and the residual sum of squares values. Based on the calculation results, the total value of the sum of squares is 2,706,840.00.
Degree of Freedom Formula
If the sum of square regression and sum of square residuals have been calculated, the next step is to calculate the degrees of freedom. It is also performed on the degrees of freedom of the regression model and the degrees of freedom of the residual model to calculate the degrees of freedom.
The formula used to calculate the degrees of freedom of the regression model and the degrees of freedom of the residual model can be seen in the figure below:
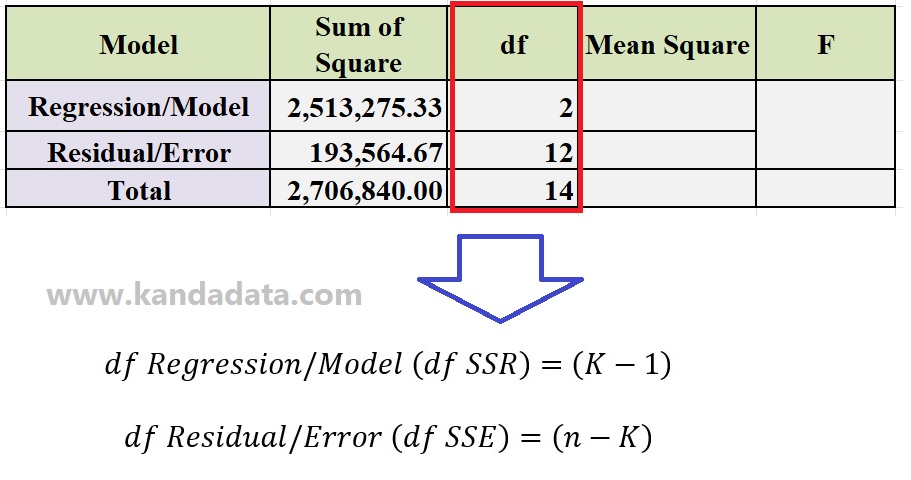
In the formula for calculating the degrees of freedom for the regression model, it is known that the formula is K-1. K denotes the total number of variables used in the model.
Based on the case examples used in this article, namely using multiple linear regression with two independent variables. Therefore, it can be concluded that the total number of variables used is 3, consisting of one dependent variable and two independent variables.
To calculate the degrees of freedom in the regression model, it is equal to 3 minus 1, so a degree of freedom of 2 is obtained. Furthermore, to calculate the degrees of freedom in the residuals, use the n-K formula, where n indicates the number of observations used in this model.
Based on the number of observations, it is known that n is 15. Therefore, to calculate the degree of freedom value in the residual model, 15 is deducted by 3, so that the degree of freedom value is 12.
To figure out the total degrees of freedom in the ANOVA table, all that’s left to do is add up the degrees of freedom of the regression model and the degrees of freedom of the residual model. This gives a total of 14 degrees of freedom.
Mean Square Formula
To calculate the mean square, you must first calculate the sum of square and degrees of freedom. The mean square calculation formula is simpler than the previous calculation formula.
The formula for calculating the mean square in the ANOVA table can be seen in the image below:
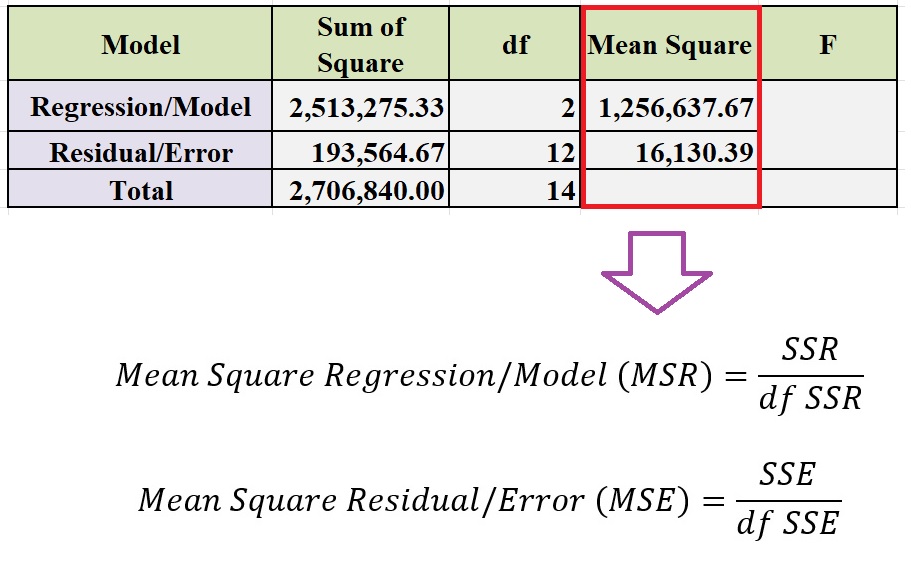
Based on the picture above, calculating the mean square regression is done by dividing the sum of square regression by the degree of freedom of the regression model.
Furthermore, the mean square residual is calculated by dividing the value of the sum of square residuals by the degree of freedom of the residual model. Based on the calculation results, the mean square regression value is 1,256,637.67, and the mean square residual is 16,130.39.
F-statistics Formula
If the mean square regression and mean square residual calculations have been performed, the formula used to calculate the value of the F-statistic is used. The formula for calculating F-statistics can be seen in the image below:
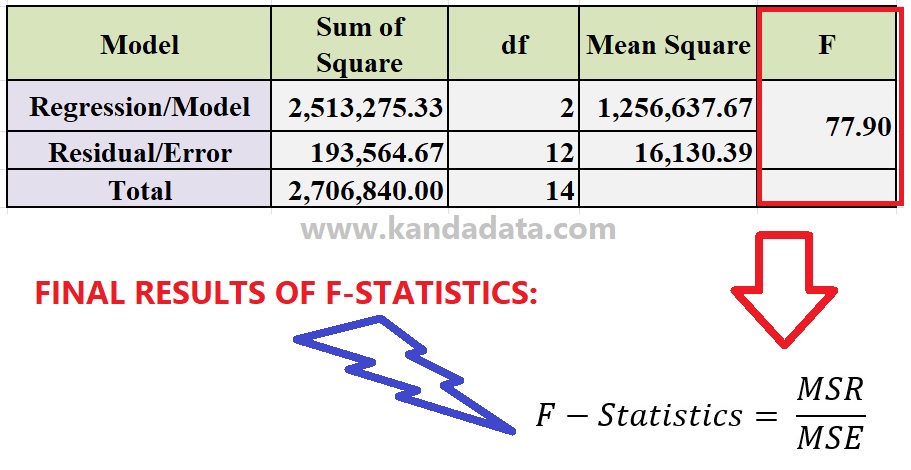
Based on the calculation results in the figure above, the F-statistic is obtained by dividing the mean square regression value by the mean square residual value. The calculation results show that the F-statistic is 77.90.
Based on the formula that has been written in the previous paragraph, it can be recapitulated in the ANOVA table, which can be seen in the image below:
This is an article that Kanda Data can write on this occasion regarding the formula used to calculate the analysis of variance (ANOVA) table in regression analysis. To master the calculation of Analysis of Variance (ANOVA) in regression analysis and its application in business and economic models, I recommend the book Regression Analysis: Understanding and Building Business and Economic Models Using Excel. Hopefully, you will find this article useful. Wait for the article update the following week!

One thought on “<strong>Formula to Calculate Analysis of Variance (ANOVA) in Regression Analysis</strong>”