
The one-way ANOVA test is a parametric statistical test used to examine the differences in means across more than two sample groups. It is important to emphasize that the one-way ANOVA is only applicable when comparing three or more groups. If you are comparing the means of only two groups, then a t-test should be used instead.
In this article, Kanda Data provides a tutorial on how to perform a one-way ANOVA test and how to interpret the results. This article is written because many researchers or students working on their theses often need to compare the means of three or more groups of samples. In this tutorial, I will use a case study example involving non-laboratory data.
Case Study Example
To demonstrate how to perform a one-way ANOVA, I will use a non-laboratory research case study. A researcher wants to examine whether there are differences in the average daily weight gain of beef cattle after being fed three different types of feed.
The researcher uses three types of feed in the study: (1) Feed A: natural forage; (2) Feed B: a combination of forage and concentrate; and (3) Feed C: fermented feed.
The researcher uses 30 cows, divided into three groups, with 10 cows per group. Each group receives one of the three types of feed: A, B, or C.
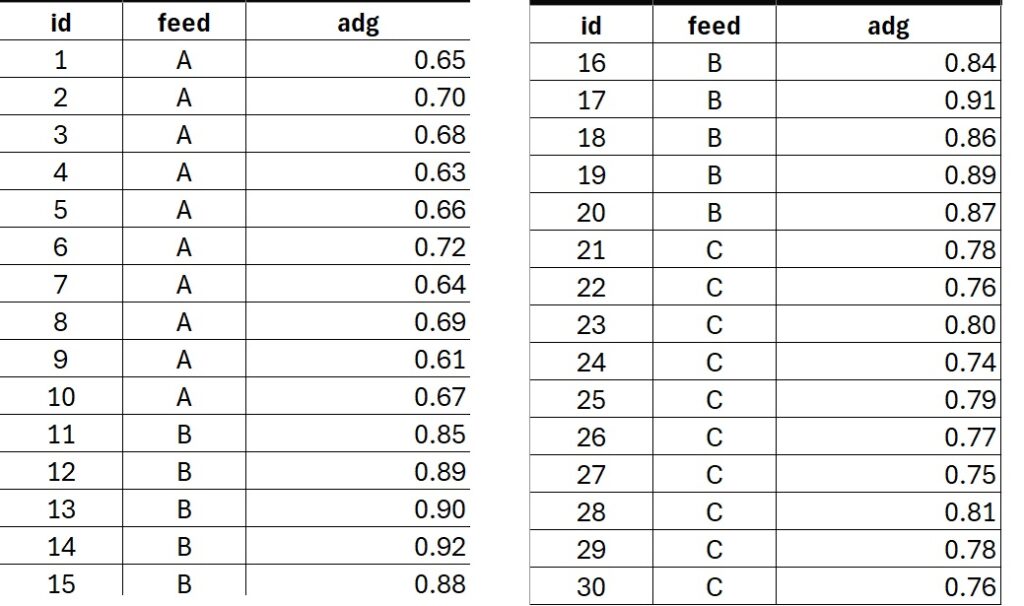
From this study, a dataset was obtained which will be used as the example for this tutorial. The detailed data can be seen in the following table:
One-Way ANOVA Tutorial in STATA
The one-way ANOVA analysis in this tutorial is conducted using STATA software. First, we need to import the data from an Excel file. To do this: (1) Click File; (2) Select Import; and (3) Choose Excel Spreadsheet.
In the window that opens, browse for the Excel file where the data is stored. In the data preview window, check the box Import first rows as variable names, then click OK. Next, conduct the one-way ANOVA test by typing the following command:
oneway adg feed
After entering this command, press Enter, and the analysis output will appear as shown in the figure below:
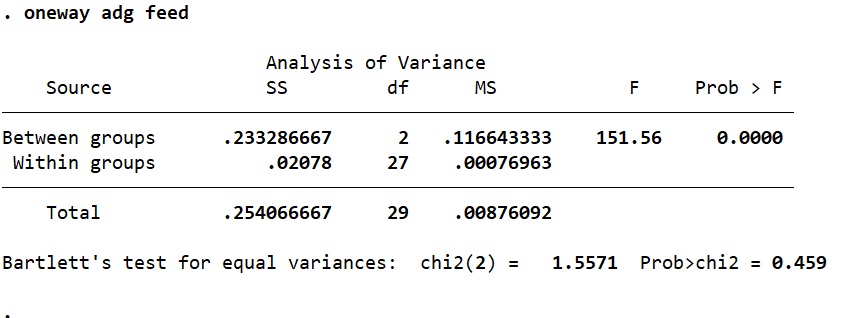
From the output, it can be seen that there are significant differences between Feed A, Feed B, and Feed C, as indicated by the p-value < 0.05. Since the one-way ANOVA result shows significant differences, a post-hoc test is necessary.
As an example, I will perform a Bonferroni post-hoc test. To conduct this test, use the following command:
oneway adg feed, tabulate Bonferroni
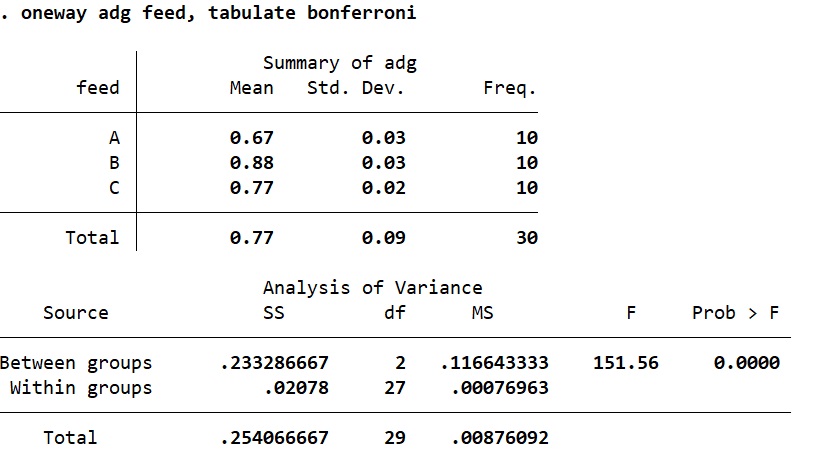
After entering the command and clicking OK, the output will appear as follows:
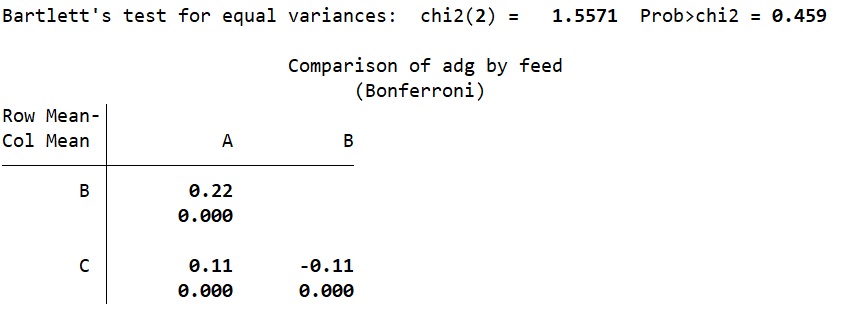
Based on the post-hoc results, it can be concluded that each type of feed shows significant differences. This includes differences between Feed A and Feed B, Feed A and Feed C, as well as Feed B and Feed C.
From the summary output, it is evident that Feed B results in the highest average daily gain (ADG), while Feed A results in the lowest average daily gain.
Conclusion
Hopefully, this one-way ANOVA tutorial provides clear guidance for those seeking information on how to perform and interpret a one-way ANOVA using STATA. Thank you for reading this article. I hope it is useful and adds to your knowledge. Stay tuned for more updates from Kanda Data in future articles.
