
Researchers must comprehend how to calculate the Analysis of variance (ANOVA) table in multiple linear regression. Table ANOVA can be used to analyze the simultaneous effects of the independent to dependent variables. The previous post I wrote, “Finding Coefficients bo, b1, and R Squared Manually in Multiple Linear Regression,” continues in this one.
I provided an Excel explanation in a previous blog on how to manually calculate the coefficients of b0, b1, b2, and R Square in multiple linear regression. Please read my previous article first if you haven’t already.
Analysis of Variance (ANOVA) Table Components
The ANOVA regression table generally computes the F value, mean square, degree of freedom, and sum of squares. There are connections between determining the values of the components I specified. Therefore, it is necessary to calculate these components in order.
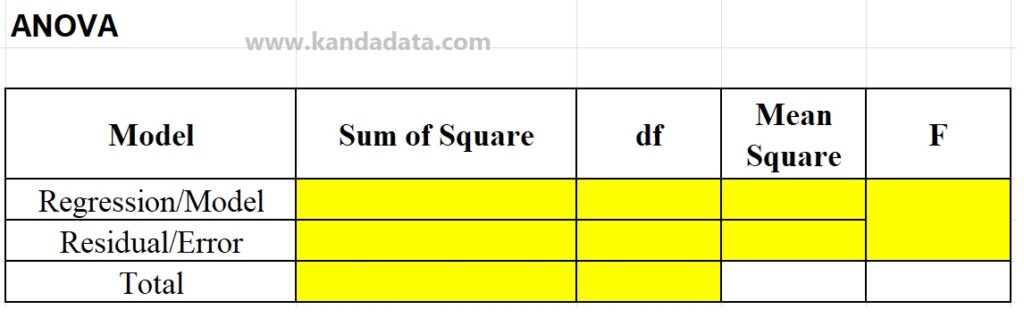
The ANOVA table has three rows, with regression/model as the first row, residual/error as the second, and total as the third. Each regression row and residual row in the ANOVA table must have its sum of squares, degrees of freedom, and mean square calculated.
Researchers can differentiate residuals and errors based on the current data sources used in the study. It is referred to as a residual if the researcher utilizes sample data and an error if they use population data. The illustration below shows a sample regression ANOVA table:
How to figure out the sum of square
Researchers need to be familiar with the calculation procedure I described in the preceding article, “Finding Coefficients bo, b1, and R Squared Manually in Multiple Linear Regression, ” to determine the sum of squares.
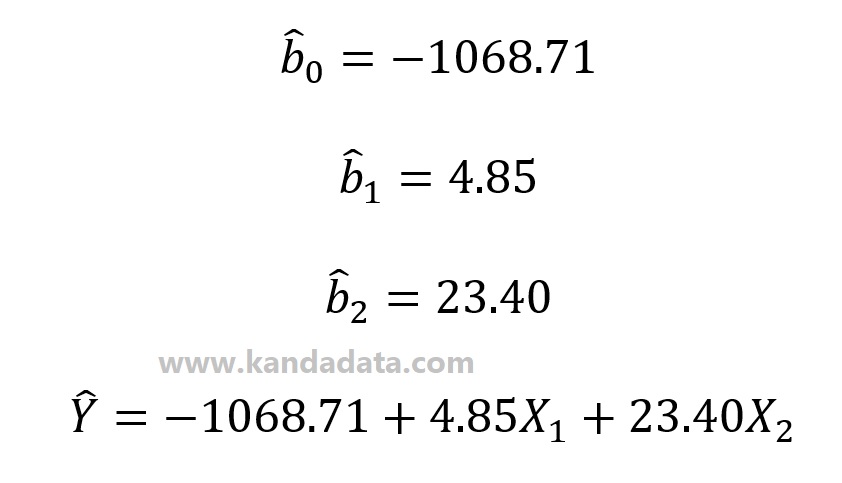
Before calculating the sum of squares, we must first estimate the regression coefficient. The Y-predicted value is determined using the estimated regression coefficient.
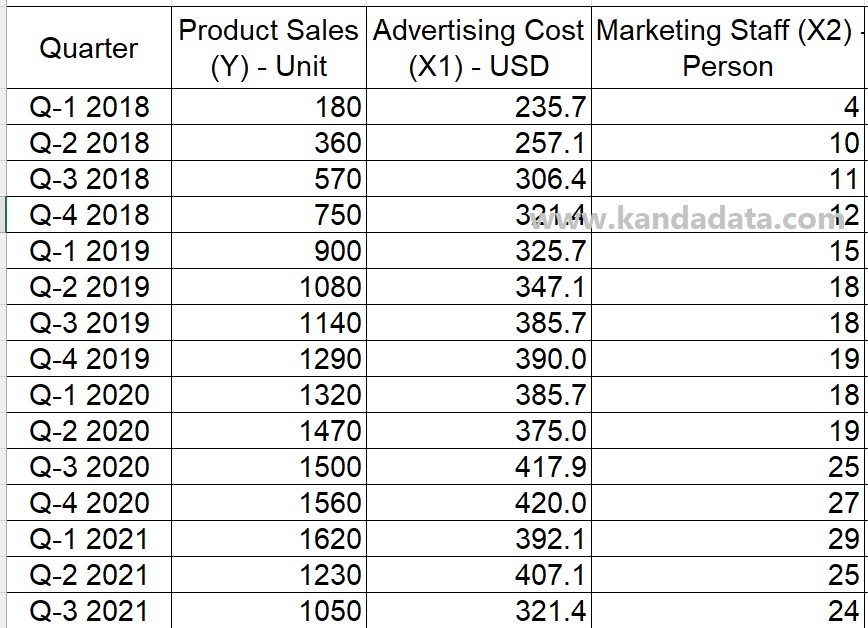
Therefore, the researcher must first determine the Y predicted value using the previously estimated coefficients b0, b1, and b2. The information we use can be double-checked in the table below to make the calculation simpler:
The researcher also made sure to determine the actual average Y value. The illustration below shows the formula used to determine the sum of square value based on the book provided by Koutsoyiannis (1977):
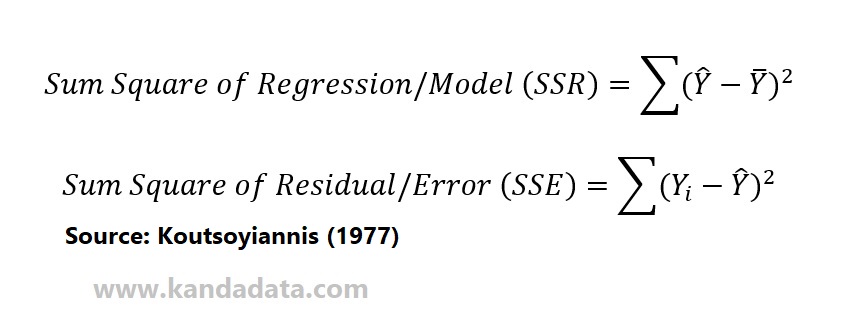
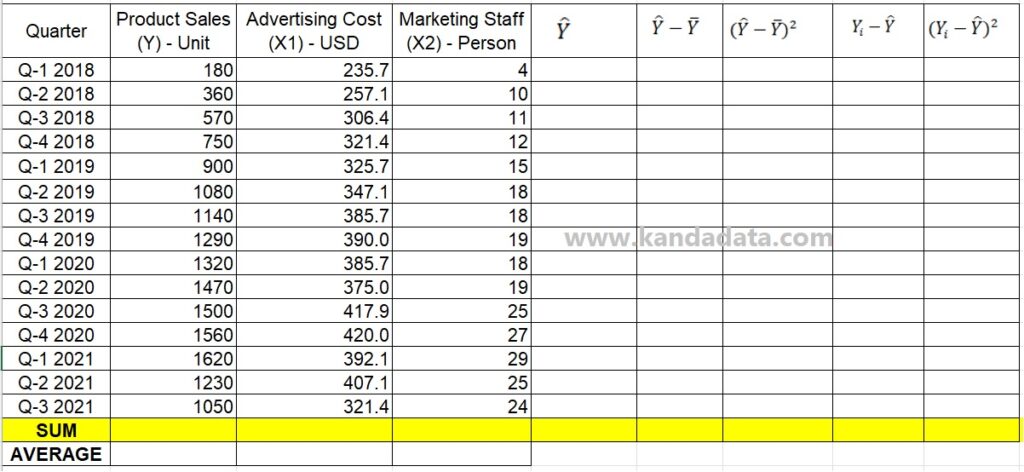
Researchers must compute the sum of square regression and the sum of square residual values using the formula mentioned above. We can develop a template for the parts needed for the calculation formula, as indicated in the table below, to make it simpler:
Using the estimated coefficient values b0 and b1, based on the calculations I described in the last post, the predicted Y value is calculated as the first calculation step. The equation used to determine the predicted Y value may be seen in the image below, which was determined using the results of the earlier calculations:
Next, input each X value from the first quarter of 2018 to the third quarter of 2021 to obtain the predicted Y value. Next, use the Excel formula template to conduct the following computations. The predicted Y value can be generated by copying and pasting the formula to quarter three of 2021. The image below shows the full results of the calculation:
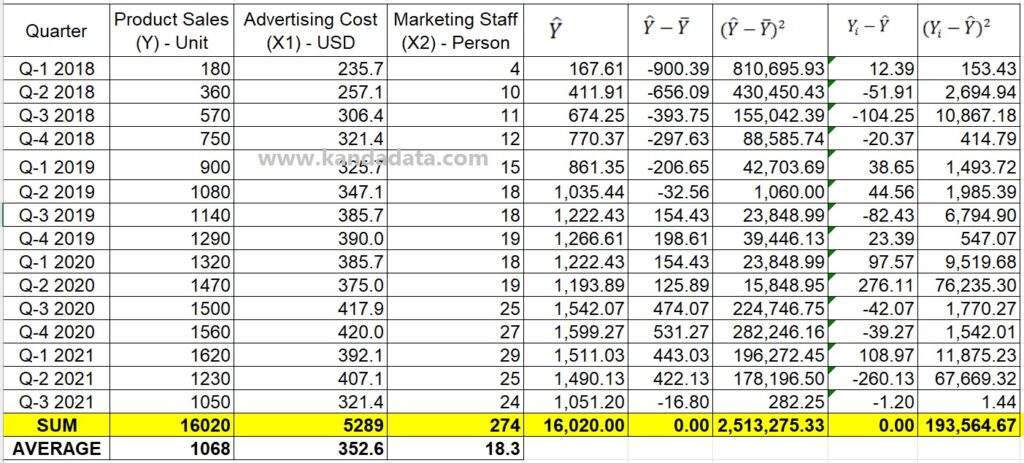
The sum of squares regression value is 2,513,275.33, and the sum of squares residual value is 193,564.67, as seen in the image above. You only need to add the sum of the square regression and square residual values to determine the overall sum of squares.
How to figure out the degree of freedom
The sum of squares is calculated first, followed by the degree of freedom. In addition, the degree of freedom includes the degree of freedom residual and degree of freedom regression. The illustration below shows the formula used to determine the degree of freedom based on the book written by Koutsoyiannis (1977):
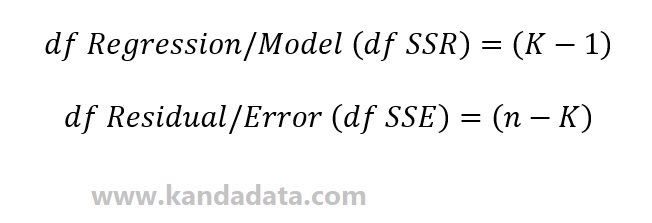
K is the number of variables used in the regression based on the formula above. Given that two independent variables are in the regression equation used in this research example, K has a value of 3.
One dependent variable and two independent variables make up K = 3. N is also the study’s total number of observations. This mini-example research makes use of n = 15. The table below shows the results of the degree of freedom value calculation:
How to calculate Mean Square and F-Statistics
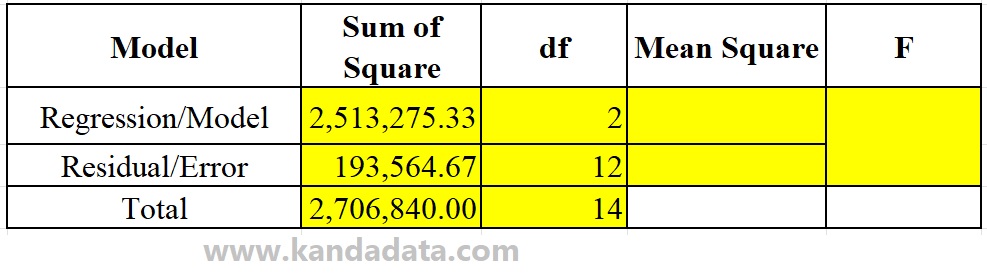
The mean square and F value are computed using the sum of squares and the degree of freedom. You can use the following formula from Koutsoyiannis (1977) to determine the mean square and F value in the ANOVA regression table:
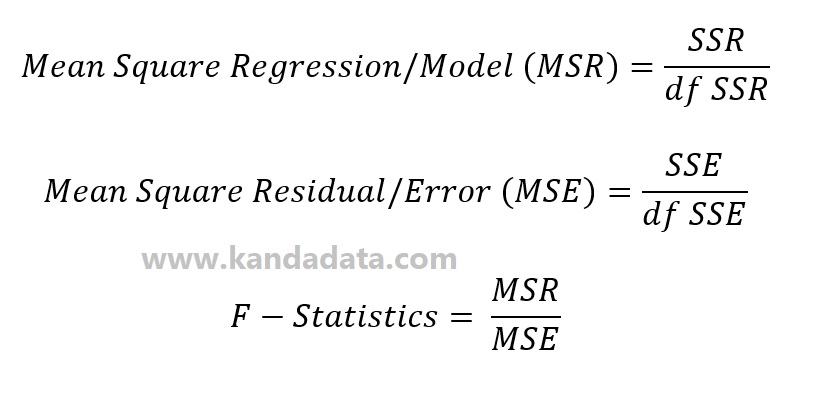
The final findings from the ANOVA regression table may be seen in the image below based on calculations completed using the following formula:
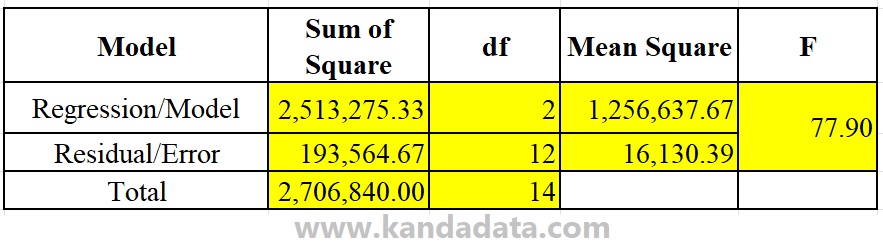
It is a manual example of how to calculate an ANOVA regression table. I hope it will be helpful to you all! Thank you.
