Category: Statistics

Can nominal scale data be analyzed using regression analysis?
Regression analysis is commonly used to examine the influence of independent variables on dependent variables observed in a study. However, regression analysis is more suitable for data with interval or ratio scales. How about data with nominal scales, can regression still be used?
Data That Cannot Be Transformed Using Natural Logarithm (Ln)
In quantitative data analysis, data transformation is not a new concept. It is a process of converting the original form of data into another form to improve the data and meet the assumptions required for quantitative data analysis.
Differences Between Paired Sample T-Test, Independent Sample T-Test, and One-Way ANOVA
Differential testing is aimed at determining the mean differences in the tested sample groups. In practice, paired sample t-test, independent sample t-test, and one-way ANOVA are often used to test means in more than one sample group.
Hypothesis Testing: Unveiling Insights in Multiple Linear Regression Analysis
In inferential statistics, we need to formulate research hypotheses. These research hypotheses are formulated according to the research objectives. Furthermore, statistical hypotheses need to be established in the analysis method, consisting of null and alternative hypotheses.
How to Create Statistical Hypotheses in Linear Regression, Correlation Analysis, and T-test
Formulating hypotheses is a crucial step in any research activity. Researchers need to conduct a series of scientifically-based research activities to test these research hypotheses. This series of scientific activities include formulating a research proposal, presenting the proposal in a research proposal seminar to gather feedback, data collection, data analysis, and hypothesis testing to draw research conclusions.
How to Choose Regression, Correlation, or Difference Test for Variable Association Analysis
Selecting the appropriate analysis method will prevent errors in concluding research results. There are various methods of data analysis that researchers can choose from. The selection of data analysis methods depends on the research objectives and the characteristics of the collected data.
How to Distinguish Cross-Section Data, Time Series Data, and Panel Data
Based on the collection method, data can be divided into cross-section, time series, and panel data. A good understanding of the differences between the three types and how to collect the three types of data will lead to the right choice of analysis.
Source, Types, and Scale of Data Measurement in Research
Research is an activity that utilizes data to be analyzed, leading to conclusions. In this regard, data is a vital instrument in research. Data represents recorded information about the research.
Data can also be defined as information related to a condition, description, and/or a particular matter. Meanwhile, statistics is the method used to process data to provide information.
Data based on its source and type
Data can be divided into two categories based on its source:
1. Primary Data
Primary data is data obtained directly from the research subjects.
2. Secondary Data
Secondary data is data obtained from other sources, not directly from the research subjects by the researcher.
Data based on its type can be divided into two categories:
1. Quantitative Data
Quantitative data is numerical data that is typically processed using statistical techniques and is objective in nature. Examples of quantitative data include milk production, GDP, GPA, and so on.
2. Qualitative Data
Qualitative data is non-numerical data, often in the form of verbal descriptions or categorizations. It is more subjective in nature and can be represented in the form of rankings for data with an ordinal scale. Examples of qualitative data include some students feeling happy about farming while others do not, the cow being large, the chicken being small, and so on.
Scale of Data Measurement
The types of data measurement scales can be categorized into four:
1. Nominal Scale
The values of the variable only differentiate one category from another. For example, various types of occupations are differentiated only by their categories, without implying that one occupation is better than another.
2. Ordinal Scale
The scale is based on rankings and differentiates the data based on order and levels. For example, levels of education ranked from the highest to the lowest or vice versa.
3. Interval Scale
Data that possesses the characteristics of an ordinal scale but also has known intervals between values. For example, the variable “age” has both value and interval information.
4. Ratio Scale
Data that has characteristics of an ordinal scale but is used to measure distances and weights. For example, the weight of a father is three times the weight of his child.
Guidelines for Data Collection
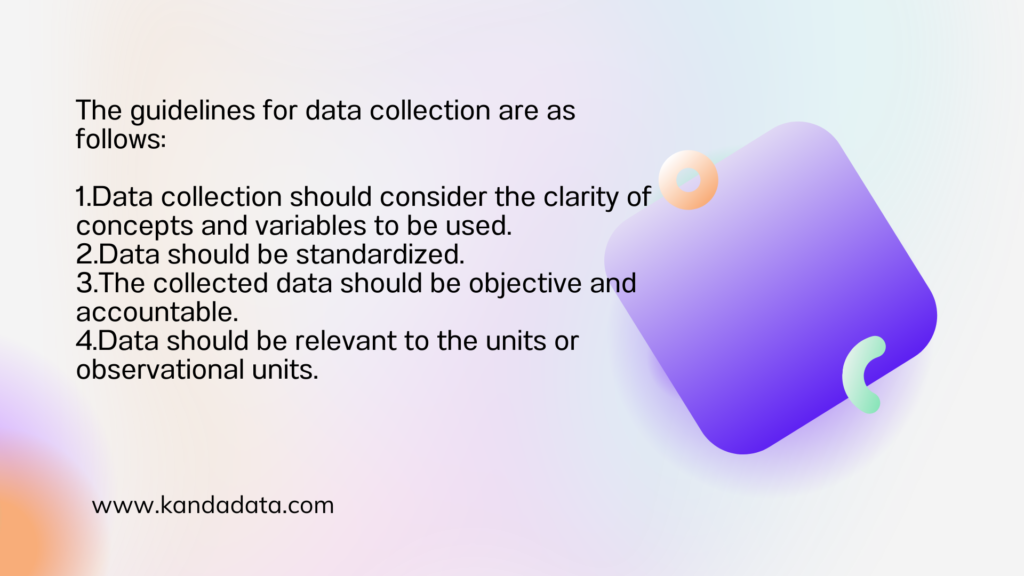
The process of data collection should adhere to data collection guidelines. This is done to ensure that the data used in the research is valid, reliable, and in accordance with scientific principles. The guidelines for data collection are as follows:
- Data collection should consider the clarity of concepts and variables to be used.
- Data should be standardized.
- The collected data should be objective and accountable.
- Data should be relevant to the units or observational units.
Survey and Experimental Research
Research can be broadly categorized into survey research and experimental research based on their implementation. Survey research utilizes and observes existing phenomena, while experimental research generates data through experiments.
Survey research is commonly used in social sciences and sciences. In the field of animal husbandry, surveys are not uncommon, as survey research is commonly employed in studies focusing on the social and economic aspects of livestock.
After conducting data collection in the field for survey research, the next step is data compilation and analysis using statistical tools. These statistical tools can include programs such as SPSS, Microsoft Excel, SAS, and others.
Conclusion
Understanding data is crucial in research activities. Understanding the types of data will determine the appropriate choice of tests. Based on the appropriate tests, accurate conclusions can be drawn.
This concludes the article that I can share on this occasion. Hopefully, it provides benefits and added value to those who need it. Stay tuned for the next article update in the following week.