Blog
How to Determine T-table and F-table in the linear regression analysis using Excel

Statistical hypothesis testing is an important stage in research activities. Based on the data that has been collected according to the research method used, the next researcher analyzes the data.
Based on the results of the data analysis, statistical hypothesis testing can then be carried out. Statistical hypothesis testing was conducted to answer research objectives and research questions. Therefore, researchers need to understand well about statistical hypothesis testing.
Multiple linear regression analysis, until now, is widely used by researchers to elaborate on the effect of independent variables on the dependent variable. In multiple linear regression analysis, statistical hypothesis testing can be done with two methods: comparing the values of F-statistics with F-tables and t-statistics with t-tables.
In the second method, researchers can calculate the value of the probability of error from alpha. On this occasion, Kanda Data will write about statistical hypothesis testing by comparing the t-statistic values with t-tables.
Case Study Example
An example of a case study used in this article is an analysis of the effect of advertising costs and marketing staff on product sales. This study uses monthly time series data during the 1st to 15th months. The data that researchers in detail have collected can be seen in the table below:
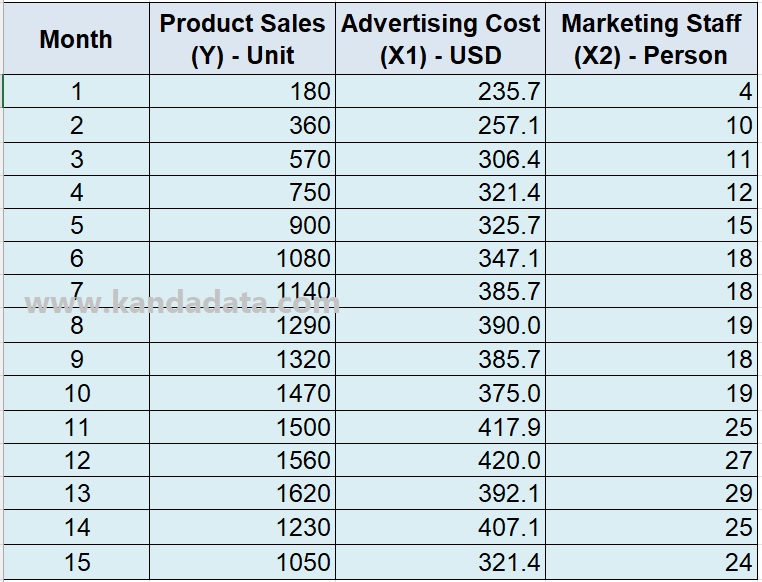
Based on the research objectives, it was determined that the independent variables consisted of advertising costs measured in US Dollars and marketing staff measured in units of people. Furthermore, the dependent variable is product sales as measured in units.
Next, the researcher tested the assumptions required in the multiple linear regression analysis of the Ordinary Least Square method. This article does not show the results of the assumption test but only the output of multiple linear regression analysis.
For the steps of multiple linear regression analysis in Excel, you can read the article “How to Perform Multiple Linear Regression using Data Analysis in Excel“. Based on the results of multiple linear regression analysis, the output for statistical hypothesis testing is as follows:
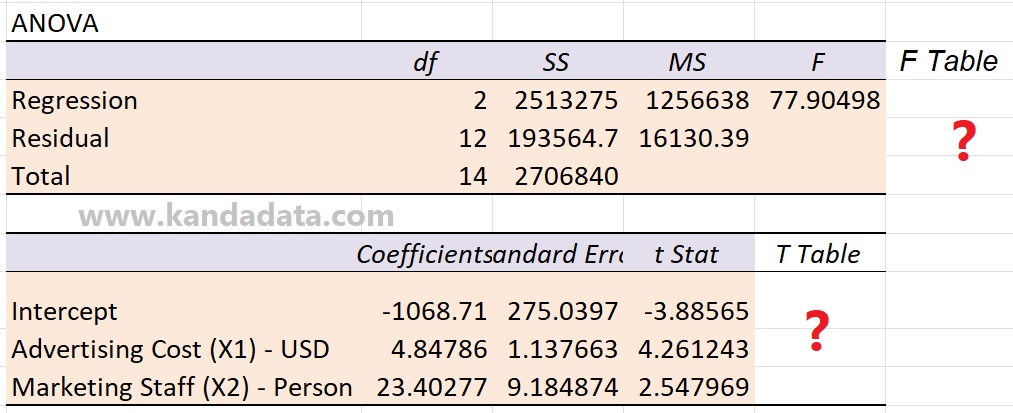
Based on the output of the multiple linear regression analysis above, it is known that the F-statistic value is 77.90498. Meanwhile, the t-statistic value for the advertising costs variable is 4.261243, and the t-statistic for the marketing staff variable is 2.547969.
In order to be able to perform statistical hypothesis testing by comparing F-statistics and t-statistics with F-tables and t-tables, it is necessary to determine the value of F-tables and t-tables.
How to determine F-table values in Excel
To find the value of the F-table in multiple linear regression, researchers can use the help of the F-table in the attachment to the theory book. However, along with technological developments, Excel can also easily and quickly find F-table values.
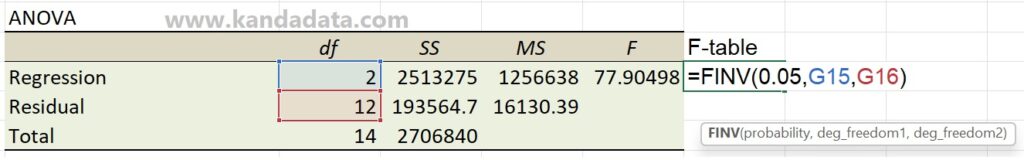
To find the F-table value, the researcher needs to write the formula in Excel “=FINV(…)”. After the researcher writes down the formula, Excel will provide instructions.
In general, researchers are asked to enter the value of the Alpha probability determined in the study. Furthermore, the researcher was asked to input the value of the 1st and 2nd degrees of freedom.
The 1st degree of freedom is obtained from the formula “K-1”. K is the total variable used in the study, including the dependent variable and independent variable. Furthermore, the 2nd degree of freedom is obtained from the “n-K” formula, where n is the number of observations in the study. In detail, the F-table formula can be seen in the image below:
Based on the picture above, it is known that the alpha set in the study is 5%. Furthermore, in the research example in this article, the number of variables used in multiple linear regression consists of one dependent variable and two independent variables. Therefore, the first degree of freedom is 2.
Furthermore, in the study, as many as 15 samples were collected. Therefore, the second degree of freedom is 12. Based on the calculation results, the F-table value is 3.88529.
The results show that the F-statistic is greater than the F-table, so it can be concluded that the null hypothesis is rejected. Because the null hypothesis is rejected, the alternative hypothesis is accepted. The test results can be concluded that the costs of advertising and marketing staff simultaneously significantly affect product sales.
How to determine T-table values in Excel
The value of the T-table can be determined by writing a formula in Excel. Based on the multiple linear regression analysis results, to test the statistical hypothesis on the variables of advertising costs and marketing staff, only one T-table value needs to be determined.
Researchers need to write the formula in Excel: “=TINV(…). The next researcher will find instructions provided by Excel. The researcher is asked to input the Alpha probability and degrees of freedom. In detail, the formula used to determine the t-table in Excel can be seen in the picture below:
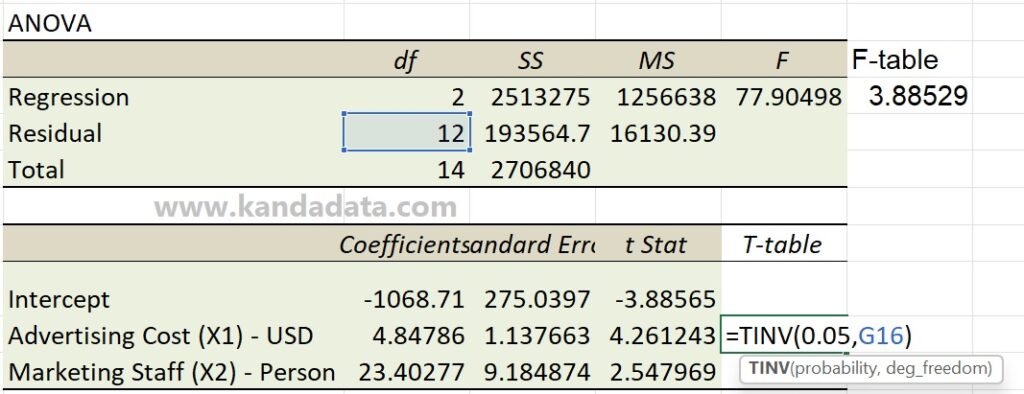
Based on the picture above, the alpha probability is 5%. The degree of freedom formula is n-K, where n is the total number of observations used in the study, and K is the total number of variables used.
The calculation results obtained a t-table value of 2.178813. The statistical hypothesis test for the advertising cost variable shows that T-statistics > T-table, thus rejecting the null hypothesis. Therefore, it can be concluded that advertising costs partially significantly affect product sales.
Furthermore, testing the statistical hypothesis on the marketing staff variable also shows that T-statistics > T-table, so it is concluded that the null hypothesis is rejected. Thus, it can be concluded that marketing staff partially also significantly affects product sales.
It is the article I can write on this occasion. Hopefully useful for all of you. Wait for the article update the following week. Thank You.