Blog
How to Find P-Value and T-Distribution Table using Excel

Testing the research hypothesis is an important step that needs to be understood by researchers. Each research objective can be answered through statistical analysis according to the researcher’s chosen analytical method. Therefore, researchers must conduct statistical hypothesis testing properly and correctly.
Statistical hypothesis testing can be divided into two: the null hypothesis and the alternative hypothesis. In principle, statistical hypothesis testing is carried out to test the null hypothesis. Therefore, in statistical hypothesis testing, a researcher must first create the null and alternative hypotheses.
Statistical hypothesis testing can be done using two criteria. Researchers can choose one of the criteria to test the null hypothesis. Testing the statistical hypothesis using these two criteria will obtain the same conclusion.
Hypothesis testing criteria can use a comparison of t-statistics/F-statistics with T-table/F-table. Another criterion in statistical hypothesis testing using the p-value. Therefore, it showed the importance of understanding by researchers in testing the statistical hypothesis.
Therefore, on this occasion, Kanda Data will write about how to find the p-value and T-distribution tables. Before discussing the tutorial further, it is important for researchers to understand “How to Distinguish 0.01, 0.05, and 0.10 Significance Levels in Statistics“.
Statistical Hypothesis Test on Linear Regression
As exercise material, I have prepared an example of a case study using the linear regression OLS method. The purpose of this case study is to find out how the influence of advertising costs and marketing staff on product sales. Based on the research objectives, the next researcher compiled the linear regression equation as follows:
Y = b0 + b1X1 + b2X2 + e
Description:
Y = Product sales (units)
X1 = Advertising costs (100 USD)
X2 = Marketing staff (person)
b0 = Intercepts
b1, b2 = Regression estimation coefficients
e = Error or disturbance error
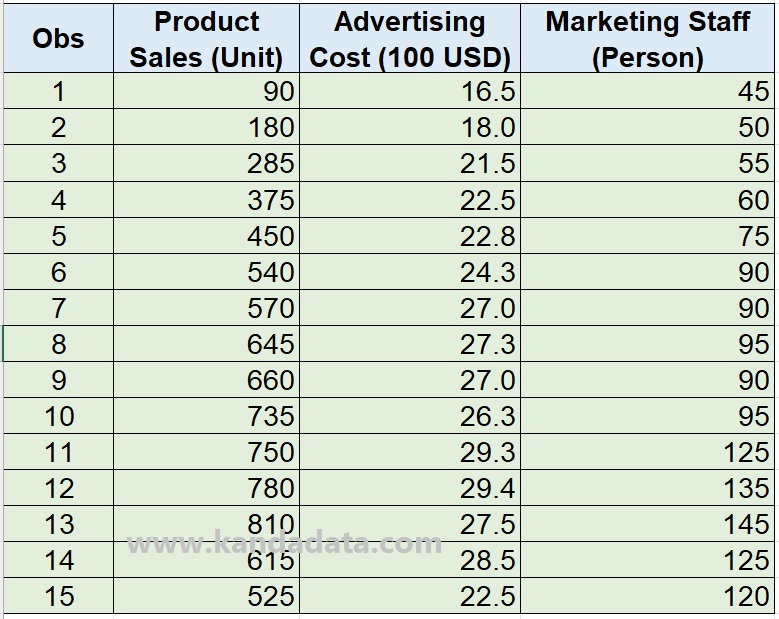
Based on the regression equation that the researcher has created, the researcher then collects data from as many as 15 observations which can be seen in detail in the table below:
How to Create Statistical Hypothesis Test
Following the research objectives of the case study, the researcher wanted to determine the influence of advertising costs and marketing staff on product sales. Researchers want to know whether each independent variable has a significant effect on product sales.
Based on the theory and results of previous research shows that the costs of advertising and marketing staff positively affect product sales. Therefore, the researchers create the research hypothesis that advertising costs and marketing staff have a significant effect on product sales.
The researcher then develops statistical hypotheses to prove whether the research hypothesis is true or false. The research hypothesis is created into a null hypothesis and an alternative hypothesis. In detail, the formulation of the hypothesis is as follows:
H0: Advertising costs partially have no significant effect on product sales
Ha: Advertising costs partially have a significant effect on product sales
H0: Marketing staff partially does not have a significant effect on product sales
Ha: Marketing staff partially has a significant effect on product sales
How to Find P-Value and T-Distribution Table
The next step that needs to be done by researchers is to test the statistical hypotheses that have been compiled. As I wrote in the previous paragraph, statistical hypothesis testing can use two criteria: comparing t statistics with t tables and p-values.
On this occasion, I used Excel to find p-value and T-table. If the researcher performs calculations manually in Excel, the researcher must first calculate the p-value and T-table before concluding statistical hypothesis testing.
1. Statistical hypothesis test for the effect of advertising costs on product sales
To calculate the p-value, researchers must perform t-statistical calculations manually or through the output analysis results. Based on the results of previous calculations, the t-statistics for the advertising cost variable is 4.89363.
The next step is calculating the P-value, and the researcher must look for the degrees of freedom. The degree of freedom in the regression equation is obtained by subtracting the number of observations with the total variables used in the regression equation.
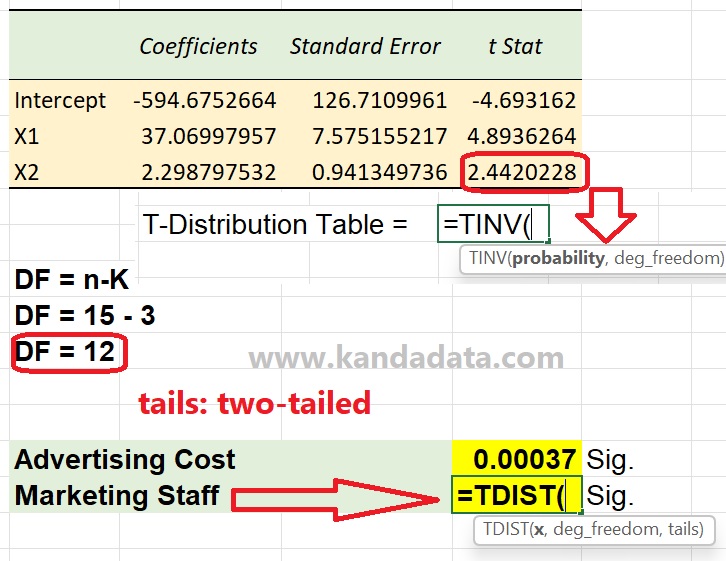
Based on the case study example, it is known that the number of observations is 15, and the number of variables is 3, so the degree of freedom is 12. To calculate the researcher’s P-value, type the formula in excel =TDIST(…), which in detail can be seen in the image below:

In the next step, researchers need to follow the instructions in the picture above. In the formula, the researcher inputs x = 4.89363, then the degrees of freedom are 12. As for tails, it is filled with 2, which shows that in multiple linear regression, two tails are used.
To calculate the T-table value, the researcher needs to type the formula in excel =TINV(….), as shown above. In the picture above, it is also known that under the formula, there are instructions that need to be followed up by researchers.
In generating the t-table, the researcher only needs to fill in the probability and degrees of freedom. In the research case study example above, the probability uses 0.05, and the degree of freedom is 12. Based on the calculation results for both the p-value and the T-table, the results are as shown in the image below:
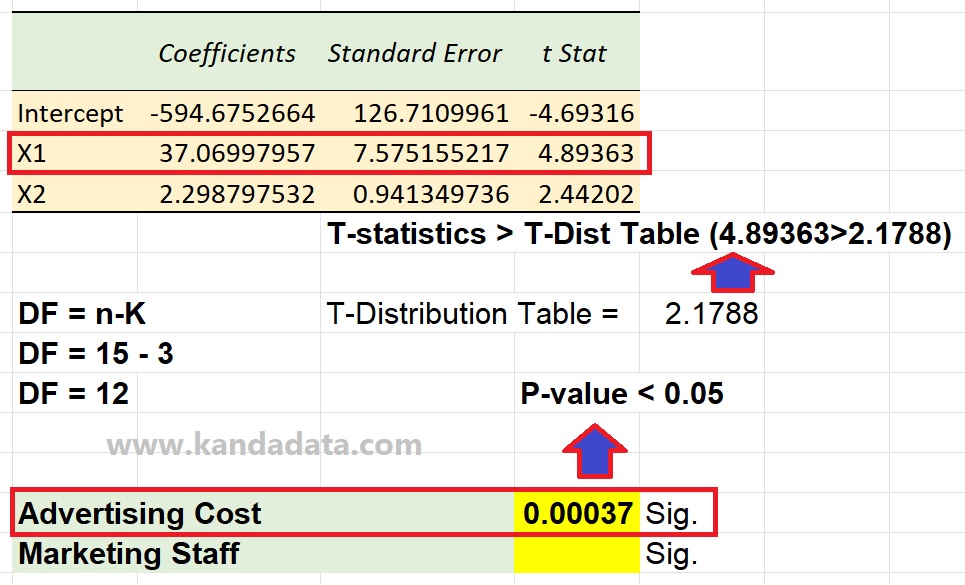
Based on the picture above, it can be seen that p-value = 0.00037, where this value is less than 0.05, so H0 is rejected, or Ha is accepted. Furthermore, for comparison, the t-statistics of 4.89363 was greater than the t-table of 2.1788, so it can be concluded that H0 is rejected or Ha is accepted.
Thus, using the p-value and the t-table comparison, the conclusion was exactly the same, namely that H0 is rejected or accepted. Therefore, it can be concluded that advertising costs partially have a significant effect on product sales.
2. Statistical hypothesis test for the effect of marketing staff on product sales
With the same principles and calculation method, p-value and t-table calculations can be performed for marketing staff variables. Researchers can follow the steps as shown in the image below:
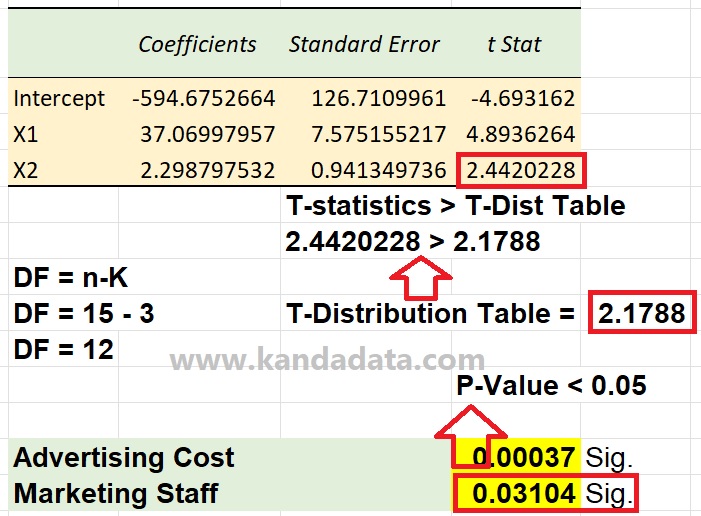
Based on the picture above, the p-value is less than 0.05, and the t statistic was greater than the t table, so it can be concluded that H0 is rejected or Ha is accepted. Therefore, it can be concluded that marketing staff partially significantly affects product sales.
It is an article that Kanda Data can write on this occasion, which discusses how to find and calculate p-value and t table using Excel. Hopefully, this article can be useful for all of you. Could you wait for our article update next week? Thank You.