Blog
How to Find Variance and Standard Deviation in Excel
Variance and standard deviation are components of statistical values that are most often found in descriptive analysis. When we perform statistical software analysis, we will find the value of variance and standard deviation if we enable descriptive statistics.
The previous article discussed the relationship between the variance value and the standard error. For more detailed information, you can read the article entitled: “How Does High Variance Affect Hypothesis Testing In Linear Regression?“
I will not discuss the basic theory of variance and standard deviation on this occasion. However, I will discuss the tutorial on finding variance and standard deviation in Excel.
Before sharing the tutorial, I want to make a common perception about variance and standard deviation. The standard error value is highly dependent on the variance value.
The standard deviation is obtained from the square root of the variance. If we are asked to find the variance value and already know the standard deviation value, we only need to square the standard deviation value.
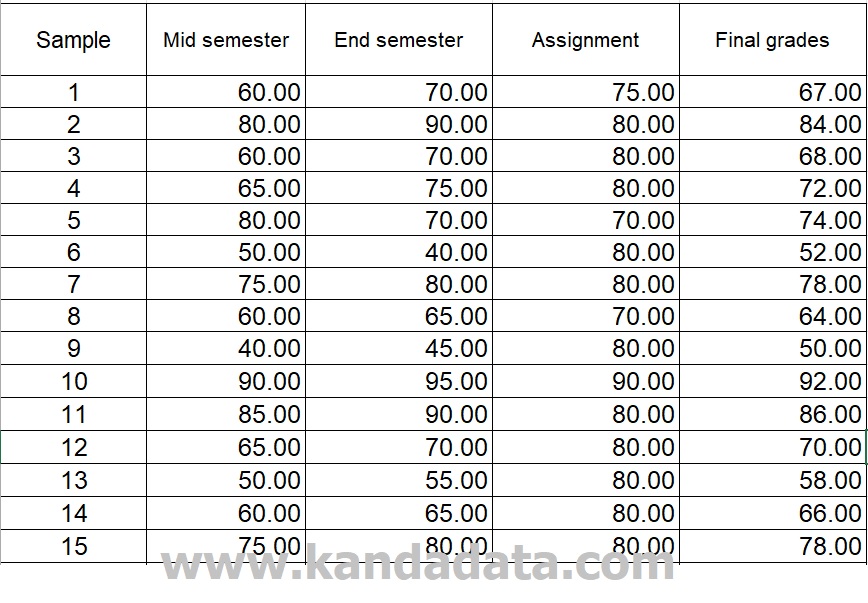
Sample data for exercise
I have prepared data for exercise to find the variance and standard deviation values easier. The data that has been collected is a sample of 15 students from 60 students who take econometrics courses.
The value component consists of mid-semester exam scores, end-semester exam scores, and assignment scores. The assessment percentages are 40% for the midterm exam, 40% for the final semester exam, and 20% for the assignment score.
Then the final value is obtained, which can be seen in the table below:
How to Find Variance in Excel
Because we use sample data, we calculate the variance value from the sample data. To find the variance value from sample data, you can type the formula in Excel as follows:
=VAR.S(number1,number2,…)
You can calculate mid-semester, end-semester, assignment, and final scores with the same formula.
How to Find Standard Deviation in Excel
The same method calculates the standard deviation value using sample data. Therefore the formula written in excel is as follows:
=STDEV.S(number1,number2,…)
Mid-semester, end-semester, assignment, and final scores are calculated using the same formula.
The result of calculating variance and standard error in Excel
Based on the results of calculations using the above formula, the following calculation results are obtained:
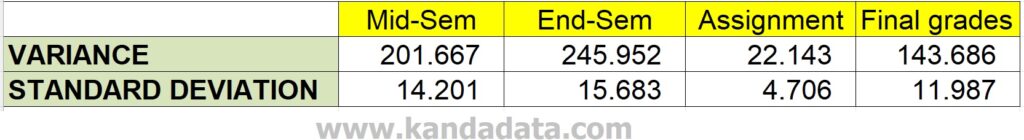
Based on the table above, we can prove that the standard deviation value is the square root of the variance value.
Well, that’s the tutorial on this occasion that Kanda Data can convey to all of you. Hopefully useful for all of you. Please wait for the next article update!