Multiple linear regression is a statistical method used to analyze two or more independent variables in relation to a dependent variable. In this article, Kanda Data will discuss how to perform multiple linear regression analysis using Excel through the Analysis Toolpak menu.
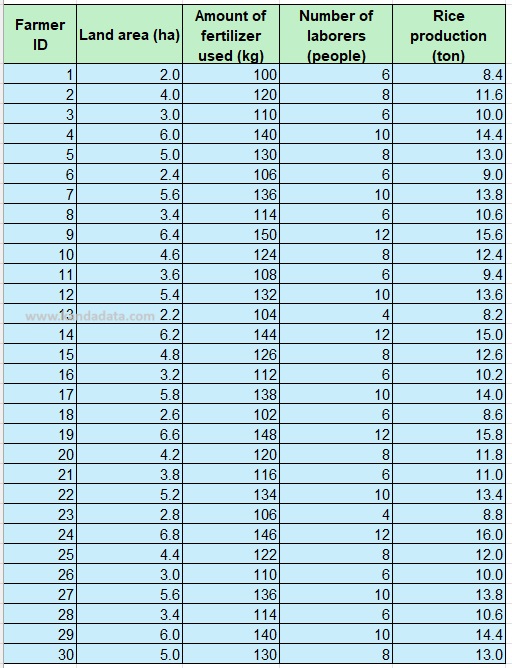
As a case study example, we will use rice production data from 30 farmers. First, Kanda Data has prepared the data that will be used for analysis. Here are the collected data from 30 farmers, including land area, amount of fertilizer used, number of laborers, and rice production:
Before conducting the regression analysis, make sure that the Data Analysis Toolpak is activated in Excel. Open Excel, click the ‘File’ tab, and select ‘Options’. In the ‘Excel Options’ window, choose ‘Add-ins’ from the left-hand panel. Select ‘Excel Add-ins’ from the drop-down menu at the bottom and click ‘Go’. Next, check the ‘Analysis Toolpak’ box and click ‘OK’.
With the Data Analysis Toolpak activated, follow these steps to perform the regression analysis:
- Click the ‘Data’ tab in the Excel ribbon, then click ‘Data Analysis’ in the Analysis group.
- In the Data Analysis dialog box, select ‘Regression’ and click ‘OK’.
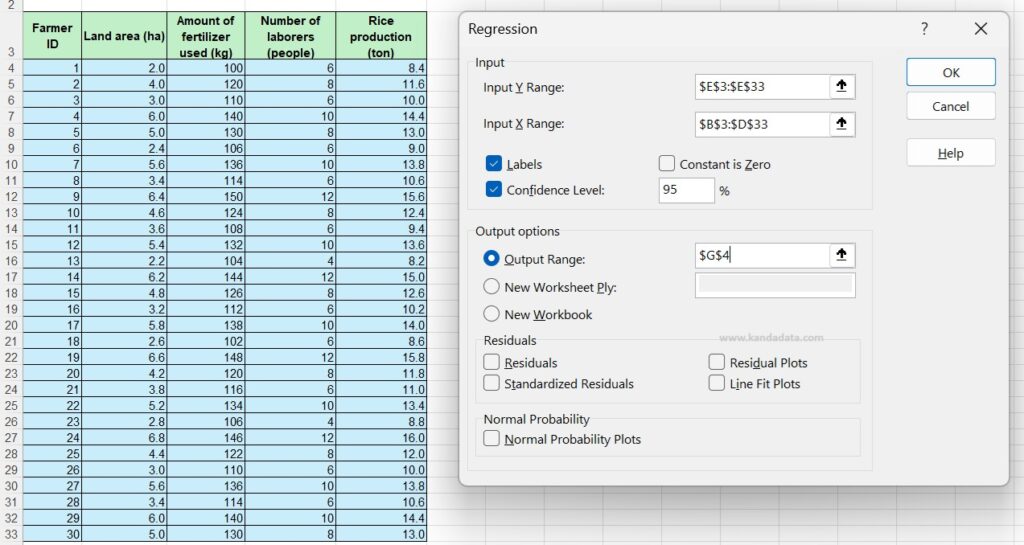
- In the Regression dialog box, enter the input range for Y (Rice Production).
- Enter the input range for X (Land Area, Amount of Fertilizer, and Number of Laborers).
- Make sure to check the ‘Labels’ box if your data has column headers.
- Choose the output range, for example, starting from cell G4. The detailed analysis steps can be seen in the image below:
- Click ‘OK’ to run the analysis.
After the analysis is complete, Excel will generate the regression output in the specified range. This output includes several important statistics, including regression coefficients. The detailed results of the analysis can be seen in the image below:
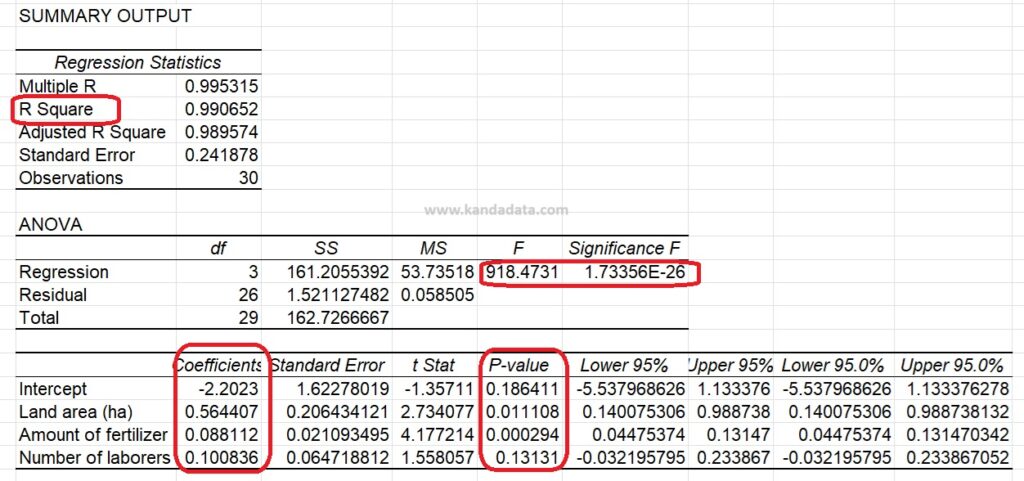
The Regression Coefficients indicate the relationship between each independent variable and the dependent variable. For example, the coefficient for ‘Land Area’ of 0.5644 indicates an increase in rice production of 0.5644 tons with a one-hectare increase in land area, while holding other variables constant.
Next, the R-squared value indicates the proportion of variance in the dependent variable that can be predicted from the independent variables. An R-squared value closer to 1 indicates a better model fit.
We also need to look at the p-values, which help determine the statistical significance of each coefficient. A p-value less than 0.05 indicates that the variable is significant. The analysis results show that the land area and amount of fertilizer variables are significant because the p-value < 0.05.
In this article, we have learned how to perform multiple linear regression analysis using Excel, as well as how to interpret the results. With this tool, we can understand the relationships between various factors affecting rice production and make better decisions based on data analysis. If you have any questions or need further assistance, feel free to leave a comment on the Kanda Data website. Thank you for reading, and we hope this article is helpful!