KANDA DATA

  • Home
  • About Us
  • Contact
  • Sitemap
  • Privacy Policy
  • Disclaimer
  • Bimbingan Online Kanda Data
Menu
  • Home
  • About Us
  • Contact
  • Sitemap
  • Privacy Policy
  • Disclaimer
  • Bimbingan Online Kanda Data
Home/Rice Production Analysis

Tag: Rice Production Analysis

Analyzing Rice Production Changes with a Paired t-Test Before and After Training Using Excel

By Kanda Data / Date Jul 04.2024 / Category Excel Tutorial for Statistics

Evaluating the effectiveness of extension programs is crucial to ensure that the interventions implemented provide positive impacts for farmers. One way to measure this effectiveness is by comparing production before and after the program using a paired t-test.

Continue Reading
Regression Tutorial using Excel

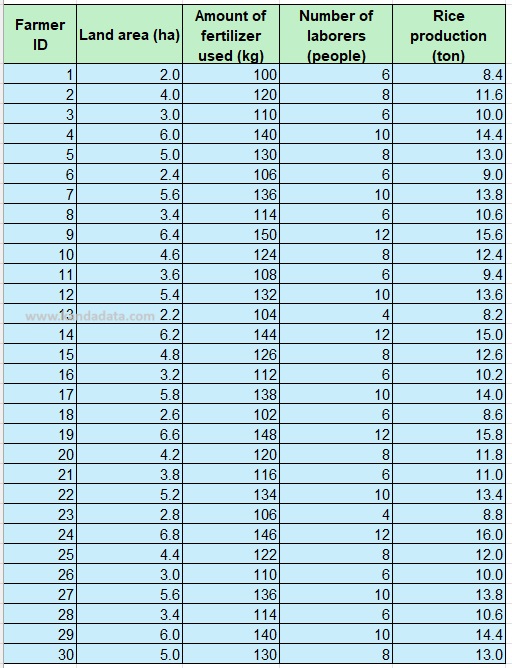
How to Perform Multiple Linear Regression in Excel | Data Analysis Toolpak Tutorial

By Kanda Data / Date Jun 29.2024

Multiple linear regression is a statistical method used to analyze two or more independent variables in relation to a dependent variable. In this article, Kanda Data will discuss how to perform multiple linear regression analysis using Excel through the Analysis Toolpak menu.

Continue Reading

Categories

  • Article Publication
  • Assumptions of Linear Regression
  • Comparison Test
  • Correlation Test
  • Data Analysis in R
  • Econometrics
  • Excel Tutorial for Statistics
  • Multiple Linear Regression
  • Nonparametric Statistics
  • Profit Analysis
  • Regression Tutorial using Excel
  • Research Methodology
  • Simple Linear Regression
  • Statistics

Popular Post

February 2026
M T W T F S S
 1
2345678
9101112131415
16171819202122
232425262728  
« Jan    
  • Alternative to the t-test When Data Are Not Normally Distributed
  • When Should Natural Logarithmic Data Transformation Be Applied?
  • Should Data Normality Testing Always Be Performed in Statistical Analysis?
  • Differences in Nominal, Ordinal, Interval, and Ratio Data Measurement Scales for Research
  • Reasons Why the R-Squared Value in Time Series Data Is Higher Than in Cross-Section Data
Copyright KANDA DATA 2026. All Rights Reserved