
When preparing data for submission to high-impact international journals, ensuring your variables meet the stringent assumptions of econometric models is critical. Unstructured, highly skewed data can lead to heteroscedasticity and biased estimators. Transforming raw economic figures, such as costs and revenues, into their logarithmic forms is a foundational technique to normalize distributions, stabilize variance, and allow for the straightforward interpretation of elasticities.
In this tutorial, Kanda Data will walk through how to quickly and accurately perform a natural log transformation using Microsoft Excel, using a standard set of production data.
In agricultural and resource economics, it is incredibly common to model relationships where variables grow multiplicatively rather than additively. By taking the natural logarithm, we linearize these relationships. For example, converting a standard production or profit function into a log-linear model.
Step-by-Step Excel Tutorial
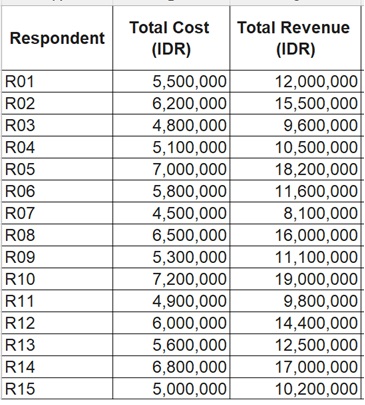
Let’s use the provided dataset, which contains the Total Cost (IDR) and Total Revenue (IDR) for 15 different respondents (R01 to R15).
Step 1: Prepare Your Worksheet
Ensure your data is organized cleanly without any merged cells in the data region.
- Column A: Respondent (R01, R02, etc.)
- Column B: Total Cost (IDR)
- Column C: Total Revenue (IDR)
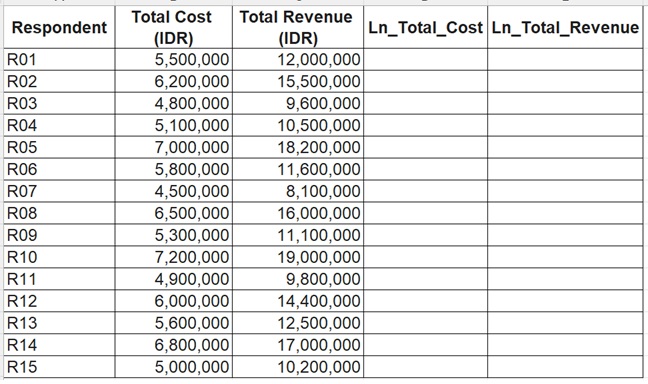
Step 2: Set Up the Target Columns
Create new headers next to your existing data to store the transformed values. This keeps your raw data intact for auditing or descriptive statistics.
In cell D1, type: Ln_Total_Cost
In cell E1, type: Ln_Total_Revenue
Step 3: Apply the Natural Log Function
Excel provides two primary logarithmic functions: LOG10() for base-10 logarithms and LN() for natural logarithms (base e). For econometrics and elasticity modeling, the natural log is the standard.
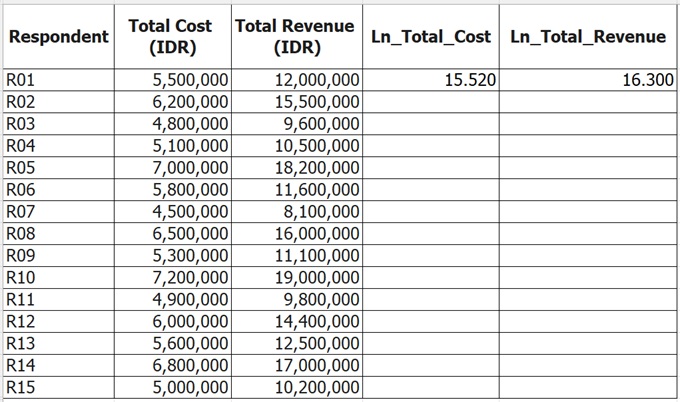
- Click on cell D2.
- Type the formula: =LN(B2)
- Press Enter. Excel will calculate the natural logarithm of 5,500,000, which is approximately 15.520.
- Click on cell E2.
- Type the formula: =LN(C2)
- Press Enter. The natural log of 12,000,000 will calculate to approximately 16.300.
Step 4: Populate the Remaining Rows
You do not need to type the formula manually for respondents R02 through R15.
- Highlight cells D2 and E2.
- Look for the small green square at the bottom-right corner of the highlighted box (the “Fill Handle”).
- Double-click the Fill Handle, or click and drag it down to row 16. Excel will automatically apply the formula to the rest of your dataset, updating the cell references dynamically.
Expected Output
Your transformed dataset should now look similar to this:
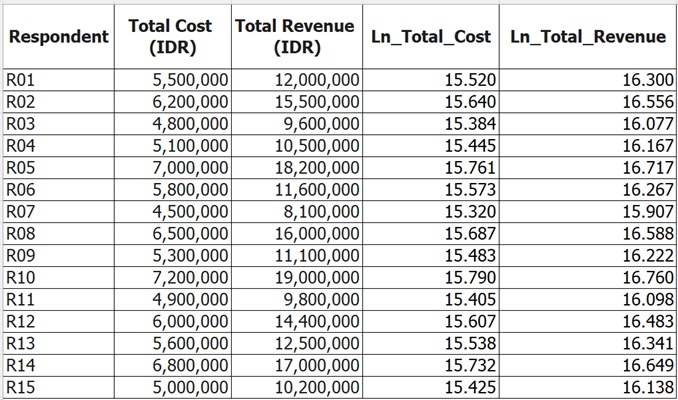
The natural log of zero or a negative number is mathematically undefined (x ≤ 0). If your dataset includes zero costs or zero revenues, the =LN() formula will return a #NUM! error. A common workaround in applied research is to add a small constant (like 1) before transformation using =LN(B2 + 1), or to utilize an Inverse Hyperbolic Sine (IHS) transformation.
By systematically preparing your variables in Excel, you ensure a clean, reproducible workflow from raw survey data to a publication-ready manuscript. Thank you for reading this article, see you in the next eduactional content from Kanda Data.
