Blog
How to test homogeneity of variance in one-way ANOVA

The homogeneity test is one of the prerequisite assumptions in the one-way ANOVA test. Researchers can use one-way ANOVA to test comparative differences in the mean of more than two data groups.
In the one-way ANOVA test, apart from the assumption that the variance between groups must be homogeneous, there are other assumptions: the data groups are normally distributed, and the sample comes from an independent group.
Researchers who use the one-way ANOVA test must understand how to test homogeneity and interpret the output. One of the homogeneity tests can use the Levene test in SPSS.
On this occasion, Kanda Data wrote a tutorial on testing homogeneity and interpreting the output in SPSS. For those who want to understand how to calculate ANOVA manually, you can read the article “Formula to Calculate Analysis of Variance (ANOVA) in Regression Analysis“
Mini research example for homogeneity test
To make it easier for researchers to understand the homogeneity test, Kanda Data has prepared an example of a Mini research case study that aims to determine feed treatment’s effect on crossbreed cattle body weight.
The study used four treatments: treatment A, treatment B, treatment C, and treatment D. Each treatment was repeated four times.
Furthermore, the researchers measured the body weight of the cows for each repetition. The results of data collection in this mini-research can be seen in detail in the table below:
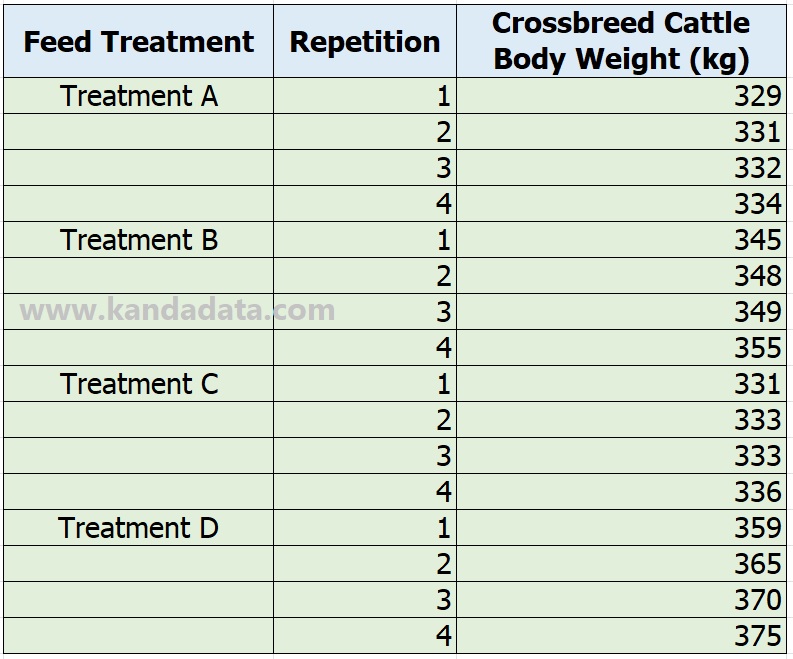
Based on the table above, it is known that the body weight of cattle is measured in kg. One one-way ANOVA test can be used to find out whether there is a difference in each treatment on body weight of cattle.
The one-way ANOVA test was carried out in this study because the study consisted of more than 2 sample groups. One of the assumptions required in the one-way ANOVA test is the variance between homogeneous sample groups. Therefore, a homogeneity test is needed.
Data Tabulation for Homogeneity Test in SPSS
The homogeneity test in my article will be carried out using SPSS. Therefore, researchers need to prepare data tabulations in SPSS.
Previously, based on the table above, research data had been inputted in Excel. To facilitate the tabulation of data in SPSS, researchers need to make coding treatments, including: Treatment A = coding 1; Treatment B = coding 2; Treatment C = coding 3; and Treatment D = coding 4. The data tabulation format in Excel can be seen in the table below:
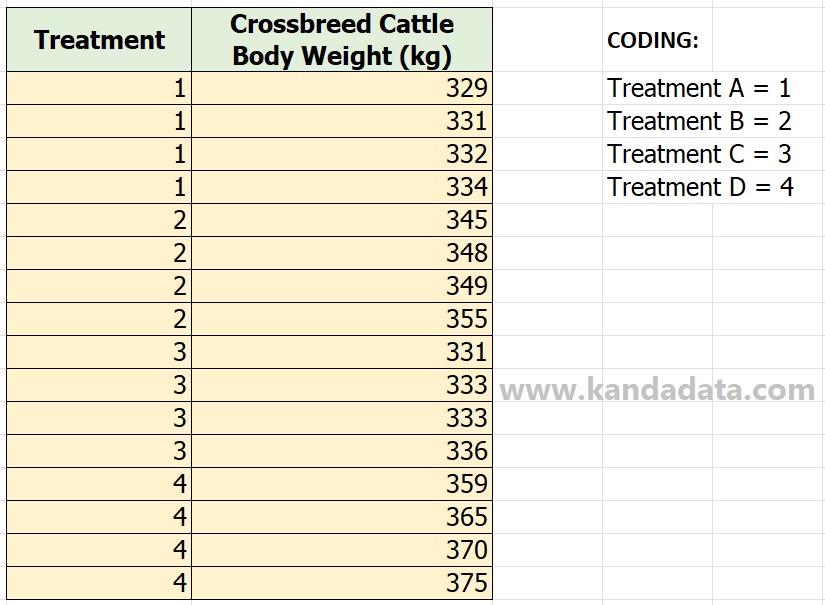
Based on the picture above, researchers can directly copy and paste into SPSS. Next, researchers need to make additional settings in the View variable window in SPSS.
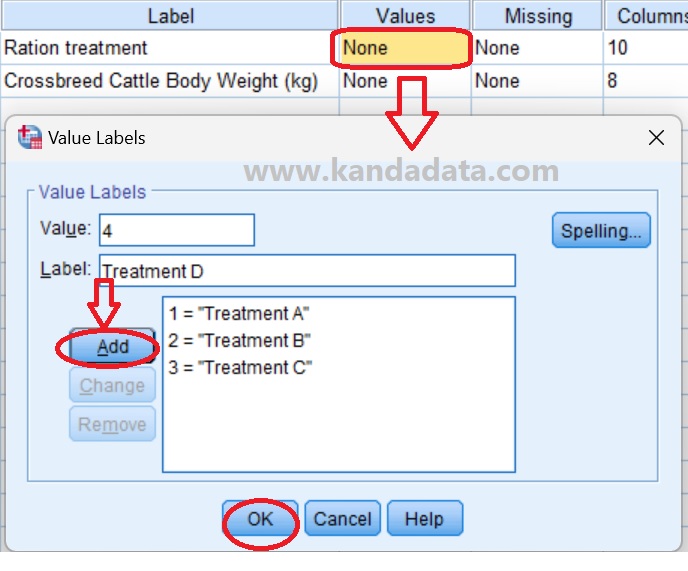
Researchers need to fill in the name, label, and measure. Furthermore, the researcher must also fill in the value for the variable coding in SPSS. The stages of variable coding of treatment variable in SPSS, in detail, can be seen in the image below:
If these steps have been carried out, it is ready to be tested for homogeneity in SPSS. The next step is to carry out each stage of the homogeneity test in SPSS correctly.
How to Test Homogeneity in SPSS
In the steps for the homogeneity test in SPSS, the researcher clicks Analyze, then selects compare means from the options in SPSS. In the next step, researchers select one-way ANOVA from several test options provided by SPSS.
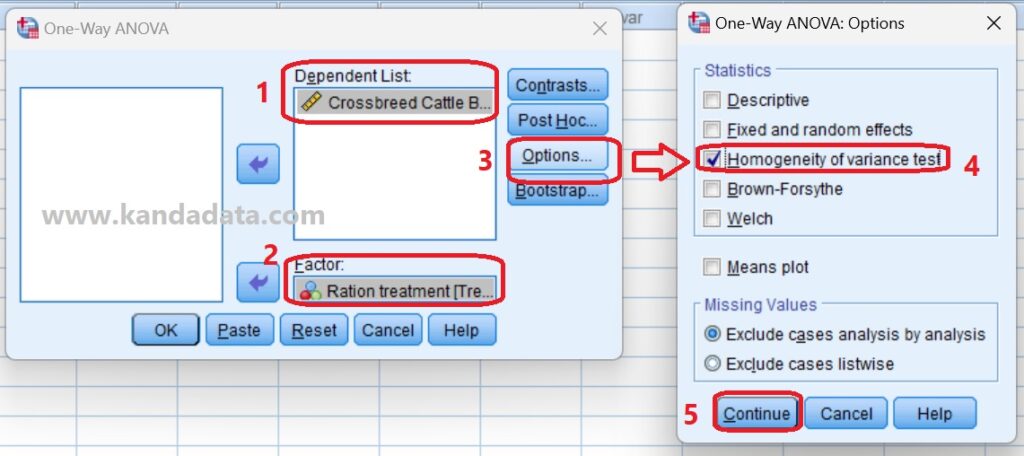
After clicking ok, the one-way ANOVA window will appear. In the next step, the researcher needs to move the crossbreed cattle bodyweight variable into the dependent list box and the treatment variable into the Factor box.
Next, the researcher needs to click Options to bring up the homogeneity of variance test. In the “one way Anova: options” window, the researcher must enable the homogeneity of variance test. In more detail, the homogeneity test stages in SPSS can be seen in the image below:
Interpretation of homogeneity test output
After clicking ok, the homogeneity test output in SPSS will appear. Based on the stages of testing the homogeneity test in SPSS, the detailed output can be seen in the image below:
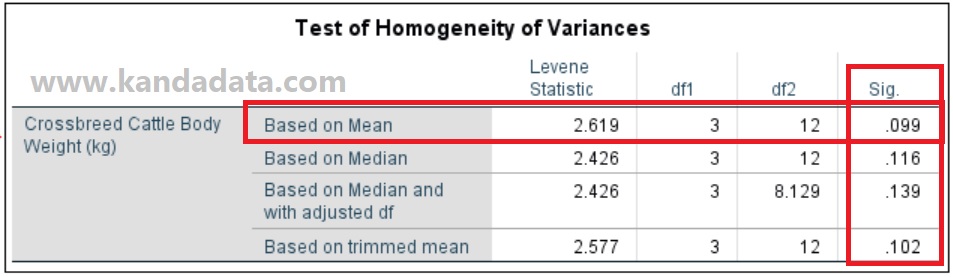
Based on the picture above, there are four groups: Based on Mean, Based on Median, Based on Median and with adjusted df, and Based on trimmed mean. Based on mean, it can be seen that the level statistical value is 2.619 with a Sig value of 0.099.
Based on these values, it shows that the p-value is greater than 0.05. It can be concluded that the null hypothesis is accepted, which indicates that the variance between groups is homogeneous.
In addition, the Sig values for the level tests Based on Median, Based on Median and with adjusted df, and Based on trimmed mean were also Sig values greater than 0.05. Thus it can be concluded that the variance between sample groups is homogeneous.
Therefore, the case study example of this research above shows that the results meet the assumption of homogeneity. Therefore, it can be continued with the one-way ANOVA test.
It is a tutorial article that Kanda Data can write on this occasion. Hopefully useful for all of you. Wait for the article update at the next opportunity.