Blog
How to Compute Multiple Linear Regression and Interpreting the Output using SPSS

Welcome back with me on the blog “Kanda Data”. On this occasion, I will discuss how to compute multiple linear regression and interpret the output using SPSS. This time, I took an example of a case study on how advertising costs and marketing personnel can influence product sales.
Please prepare your data to be analyzed using multiple linear regression. Next, you can practice directly. If you don’t have data to analyze, please read this article. Previously, I had inputted data into the SPSS application. We see that in the SPSS, there is consist of two windows, namely “Data View” and “Variable View”. I have inputted 15 observations, including product sales as the dependent variable (Y) and advertising costs (X1) and marketing personnel (X2) as independent variables.
Next, we can open “Variable View”. In the “Variable View”, I have inputted product sales as the dependent variable. In the “Name” column, I fill in Y. In the “Label” column, I filled with “Product Sales (units/month). Furthermore, I have inputted advertising cost as the first independent variable. So, in the “Name” column, I fill in X1, then in the “Label” column filled with “Advertising Cost (Million IDR/month). In the same way, I fill in the second independent variable. In the “Name” column, I fill in X2, then in the “Label” column filled with “Marketing Personel (person). For the data measurement scale, all variables used in this model are ratio data scales. Therefore, in the measure column, we select scale.
Well, it’s time for us to do a multiple linear regression analysis. This linear regression analysis uses the ordinary least square method. The regression assumption test of the OLS method will be discussed in the next article.
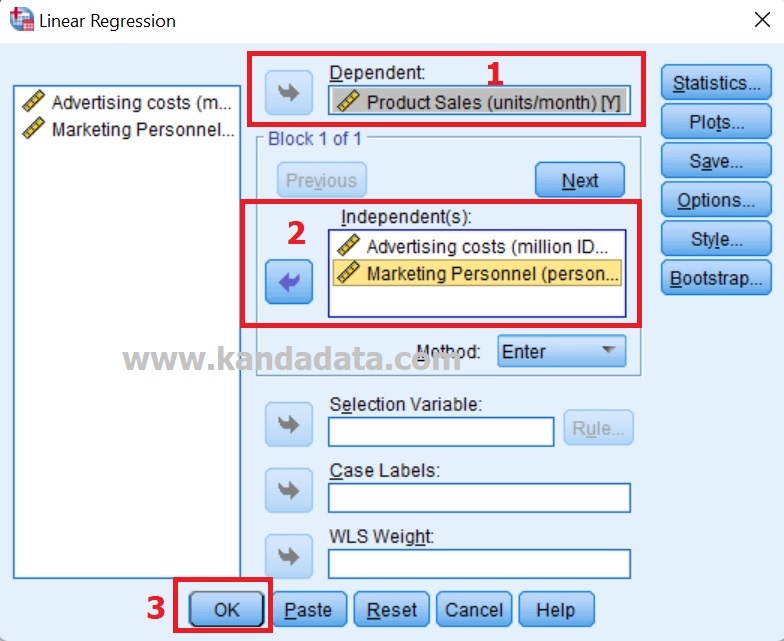
Well, now you can click “Analyze” on the menu list. Click “Regression,” then click “Linear” in the next step. You will see a new window, namely “Linear Regression. Next, move the product sales variable (Y) into the dependent box. Then move the advertising cost (X1) and marketing personnel (X2) variables into the independent box. In this case, ignore the other options, then click OK. For more details, see the image below:
After obtaining the analysis results, it is time to interpret the output. The first stage we need to look at is the Model Summary. In the model summary in the image below, you can see the value of R Square.
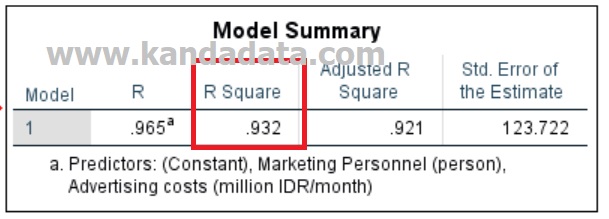
The analysis results show that the value of R Square is 0.932. We can interpret this value that the variation in product sales of 93.2% can be explained by variations in the advertising cost and marketing personnel variables. The remaining 7.8% is explained by other variables not included in the regression model.
Next, we look at the ANOVA table (see the image below):
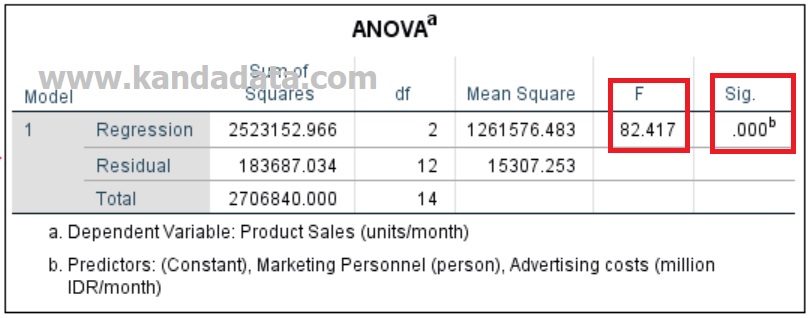
From the table, we can see the F value of 82.417. This value is greater than the table F value, generally F-Table value is 2. Or we can see that the p-value is less than 5%. It can be interpreted that advertising costs and marketing personnel simultaneously have a significant effect on product sales.
Next, see the coefficients table (see the image below):
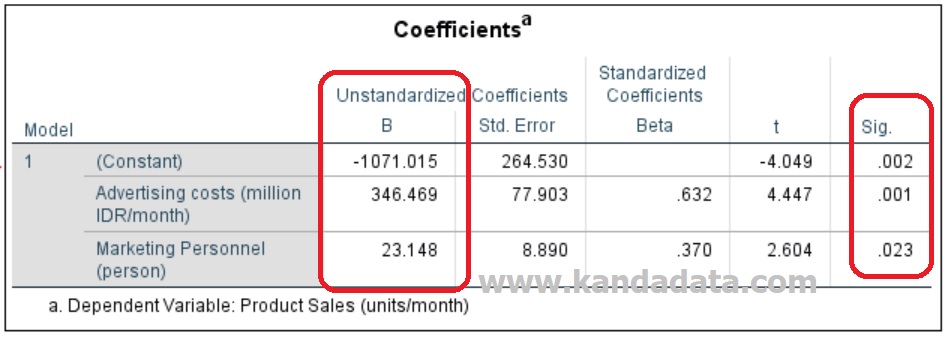
We can see the estimated coefficient value of the advertising cost variable is 346.469, and the estimated coefficient of marketing personnel is 23.148. We can use the t-value compared to the t-table value for hypothesis testing or look at the p-value. The output shows that the p-value of the advertising cost variable is less than 5%. This value shows that, partially, advertising cost significantly affects product sales.
The marketing personnel variable also shows that the p-value is between 1% and 5%. This p-value means that the p-value is less than 5%. We can conclude that partially marketing personnel significantly affect product sales. Looking at the coefficients of both advertising cost and marketing personnel variables, both are positive. This coefficient shows that if there is an increase in advertising costs, it will partially increase product sales. Likewise, if there is a partial increase in marketing personnel, it will increase product sales.
For those of you who are more comfortable learning to use audiovisuals, you can watch the video below:
Well, this is the video that I can convey on this occasion. I hope it will be beneficial for all of us. See you in the next article. Bye.
