A researcher can take samples from the population for observation and research activities. The purpose of taking samples from a population is to save costs and time in research activities.
If a researcher observes a population of a large size, the researcher will need high time and costs. Therefore, taking samples from the population using scientific principles will reduce costs and time in research activities.
Following what I have written in the previous paragraph, the sampling must comply with scientific principles. It is intended that the conclusions obtained from the sample observations can represent the population being observed.
Therefore, when taking samples for observation, you must consider several requirements for the sampling technique. To determine a sample from a population, a researcher must already have a sample frame.
The sampling frame of a population will determine the appropriate sampling technique. As I have reviewed in previous articles, the sampling is divided into two: probability sampling and non-probability sampling. What are the differences between the two sampling techniques?
The difference between probability sampling and non-probability sampling
Sampling techniques can be divided into probability sampling techniques and nonprobability sampling. The difference between the two lies in the presence or absence of a sample frame.
When researchers choose to use probability sampling, it is assumed that a sample frame is available. For example, when a researcher observes organic rice consumers in region A, the researcher must already know the total population of organic rice consumers in region A.
Furthermore, for example, the total population of organic rice consumers is 1000 people. The next thing that needs to be considered by researchers when they want to use probability sampling is the homogeneity of the data.
The second assumption must be fulfilled when researchers use the probability sampling technique is that the population members are homogeneous. What if the population members are not homogeneous and the population is divided into several strata whose members are each homogeneous? This sampling technique can use stratified random sampling, which will be reviewed in this article.
If the researcher does not have a sample frame, the researcher can use non-probability sampling techniques. Based on the example above, it can be concluded that the differences in probability sampling techniques and nonprobability sampling are:
1. The probability sampling technique provides equal opportunities for each member of the population to be selected as a sample.
2. In contrast, non-probability sampling techniques do not provide equal opportunities for each member of the population to be selected as the sample.
Definition of Stratified Random Sampling
Stratified random sampling is a sampling technique that divides the population into several elements or strata. Each stratum consists of homogeneous members.
The stratified random sampling technique is included in the sampling technique, which provides equal opportunities for each member of the population to be selected as a sample. This sampling technique is slightly different from simple random sampling.
In simple random sampling, each member of the population is all homogeneous. Meanwhile, the stratified random sampling technique divides the population into several homogeneous elements or strata.
The formula for determining the sample size using proportionate stratified random sampling
The formula researchers can use to determine sample size using proportionate stratified random sampling can use the formula below:
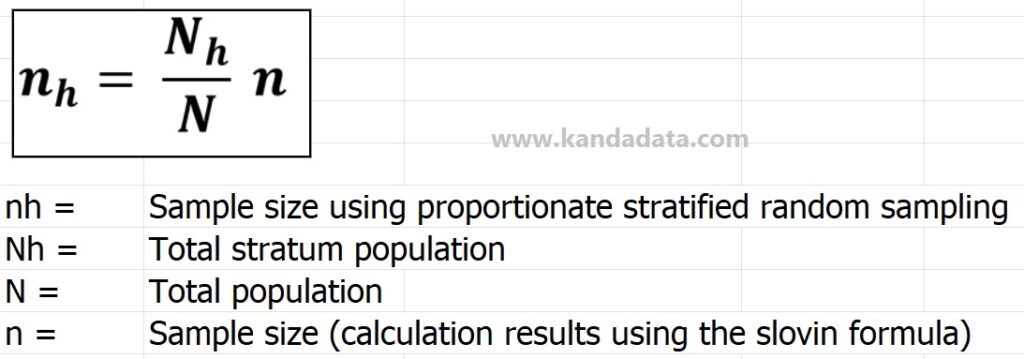
Based on the formula above, to determine the sample size, population data are needed for each stratum and the number of samples to be observed. The population size of each stratum needs to be known from the start because it will be used as the basis for determining the number of samples in each stratum. Furthermore, the researcher must also have determined the number of samples taken from all the observed strata.
How to determine the minimum sample size for all strata using the Slovin formula
To calculate the sample size for all strata, you can use the Slovin formula approach. The results of calculations using the Slovin formula can be used as the basis for the sample size, which must be taken from the entire population for all observed strata. The Slovin formula used to calculate the minimum sample size can be seen in the formula below:

To make it easier to understand how to determine the minimum sample size using the Slovin formula, you can use the following example of a mini-research case study.
A researcher will observe 500 dairy farmers in the ABC area. Based on the initial data obtained by the researcher, the Farmer population is divided into three strata, namely those with less than four heads of cattle ownership (small scale), strata with four to ten heads of cattle ownership (medium strata), and strata with more than ten heads of cattle ownership (large strata).
The total population observed by researchers consisted of 500 Farmers. Based on the 500 Farmers, they are divided into the small scale by 350 Farmers, medium scale by 100 farmers, and large scale by 50 farmers.
Researchers can calculate the sample using the Slovin formula based on this information. Based on the characteristics of the population, the researchers set a margin of error of 10%.
Based on the Slovin formula, it is known that the total population is 500 farmers. Based on the Slovin formula in the previous paragraph, the minimum sample value can be calculated to represent the observed population.
Based on the components of the calculation in the Slovin formula, the results of the calculation of the minimum sample size can be seen below:
n = N / (1+N.e^2)
n = 500 / (1+500*0.10^2
n = 83.33
n = 83 farmers
How to determine the sample using proportionate stratified random sampling
Based on the sample size calculation formula using proportionate stratified random sampling, there are three components whose values must be known, namely the total population of each stratum, the total population, and the sample size based on the calculation results using the Slovin formula.
Based on the case study example, the total population is 500 farmers consisting of 350 farmers in the small-scale strata, 100 farmers in the medium-scale strata, and 50 farmers in the large-scale strata. Based on the results of calculations using the Slovin formula, a large sample size of 83 breeders was obtained.
Furthermore, researchers can calculate the sample size of each stratum using the formula presented in the previous paragraph. Based on the formula, it can be calculated:
1. Sample size on strata small-scale:
nh = (Nh/N) .n
nh = (350 farmers/500 farmers) * 83 farmers
nh = 58 farmers
2. Sample size on the strata medium-scale strata:
nh = (Nh/N) .n
nh = (100 farmers/500 farmers) * 83 farmers
nh = 17 farmers
3. Sample size on the strata large-scale:
nh = (Nh/N) .n
nh = (50 farmers/500 farmers) * 83 farmers
nh = 8 farmers
Based on the calculation results, a recap of the sample size calculation using proportionate stratified random sampling can be seen in the table below:

Based on the articles discussed on this occasion, we can learn that using proportional stratified random sampling can be combined with the Slovin formula to determine the sample size. However, researchers do not always have to be the same for the sample size calculated by the Slovin formula.
Researchers can use a higher sample size than the minimum sample size calculated using the Slovin formula. Following the theory, taking samples from populations that meet the minimum standards using scientific principles will represent the population being observed.
For a deeper understanding of sampling techniques, including proportionate stratified random sampling, I highly recommend the book Survey Research Methods (Applied Social Research Methods). This resource offers practical insights and methods for conducting accurate and reliable survey research.
I think the discussion has answered the title of this article. Hopefully, the article I write on this occasion will be useful for all of you. Wait for the next educational article update from “Kanda Data”. Thank you!
