Blog
How to Select Random Sample using Data Analysis in Excel

The sample is part of the population, including the number and characteristics of the population. In large populations, researchers may not observe all of these populations due to limited funds, labour, and time. Sampling is one solution in research where research results can still represent the characteristics of the observed population.
In the sampling technique, statistical rules must be fulfilled. Sampling techniques can be divided into probability sampling and non-probability sampling. Probability sampling is a sampling technique that provides equal opportunities for each member of the population to be selected as a sample. On the other hand, non-probability sampling does not provide equal opportunities for each member of the population to be selected as a sample.
Examples of probability sampling techniques are simple random sampling, proportional stratified random sampling, cluster random sampling, etc. Meanwhile, examples of non-probability sampling are quota sampling, purposive sampling, quota sampling, etc.
Simple random sampling
Simple random sampling is a sampling technique that is grouped into probability sampling. In simple random sampling, some assumptions must be met to use this sampling technique.
Two assumptions must be met when researchers will use simple random sampling. The first assumption is the availability of a sampling frame. Using simple random sampling, the researcher must have obtained a sample frame including the population’s number and the population’s names to be observed.
The second assumption requirement is that the members of the population to be observed are homogeneous. If members of the population have several strata or are not homogeneous, then simple random sampling cannot be used. Researchers already have two assumptions, namely the availability of a sample frame and homogeneous data, so that they can use a simple random sampling technique.
How to choose a sample randomly
In a simple random sampling technique, each member of the population is given the same opportunity to be selected as a sample. Therefore, based on the existing population, we need to select each member of the population randomly. Random sampling can be conducted manually or using the software.
The manual sampling method is almost the same as the lottery coupon. Each member of the population gets one coupon number, and then the coupons are collected into one box. Furthermore, samples can be taken randomly according to the number of samples required from the box.
Several software can be used to assist in random sampling. One software that can be used for random sampling is Excel. The sampling technique using this software is quite easy, along with the development of technology.
Sampling technique using data analysis in Excel
Excel can be used to select a random sample from the total population. In excel, the researcher can create a random table to select a sample from the observed population. However, in excel, there is also a sampling technique that is quite easy for researchers.
Researchers can use the data analysis menu in Excel. The data analysis menu will be in Excel if the data analysis toolpak has been activated. If the data analysis menu does not exist, please activate it first.
Example of a case study of how to take a random sample
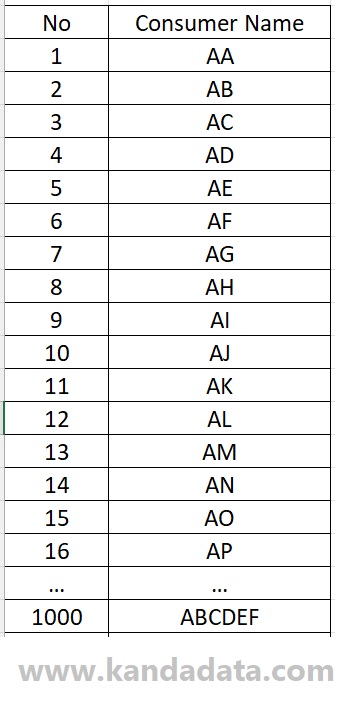
A researcher wants to observe consumer behaviour in buying a product. The researcher already has a sample frame that is 1000 consumers. Furthermore, the researcher determines the 1000 consumers as the population to be observed in the study. Researchers have also ensured that the data of population members are homogeneous.
To select the sample, the researcher has met two requirements using simple random sampling. The two assumptions are the availability of a sample frame and homogeneous population data.
Furthermore, the researchers used Excel software to help conduct random sampling. The population data to be observed can be seen in the table below:
Based on the population data above, the researcher must determine the number of samples to be taken in the study. The previous article discusses how to determine the minimum sample size. To determine the minimum number of samples, researchers can use the Slovin formula.
Based on the Slovin formula using a margin of error of 10%, the sample size is 91 consumers. Here I will give an example of how to take samples using the data analysis toolpak in Excel.
Sampling stages using the data analysis toolpak in Excel
Based on what I have written in the previous paragraph, from 1000 consumers, 91 samples will be taken. To take a random sample, please click the data menu in Excel, then click data analysis in the upper right corner.
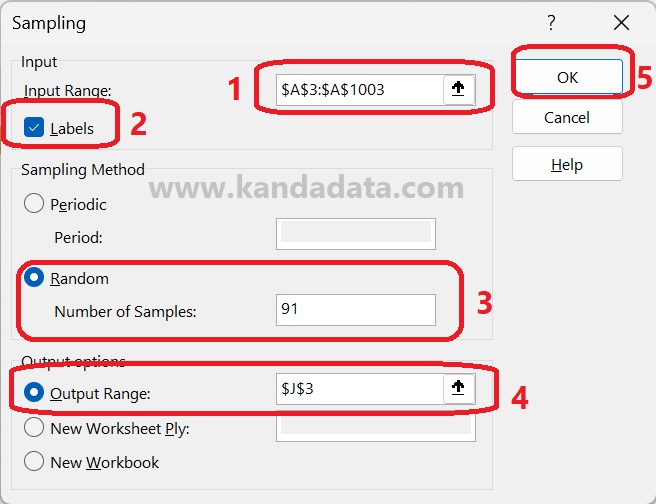
Next, the data analysis menu will appear with several choices of analysis tools. Find and select the analysis tool “sampling”, then click ok. Next, input all data on population member numbers as much as 1000 and their labels.
Because we have input data with the label, then activate the label. In the sampling method, there are two ways, namely, using periodic and random. Please click random and then fill in the number of samples as much as 91.
Furthermore, three options are given for the output option to display the results. Here I will use the “output range” to display the results in the same sheet. The steps can be seen in the image below for more details on the sampling:
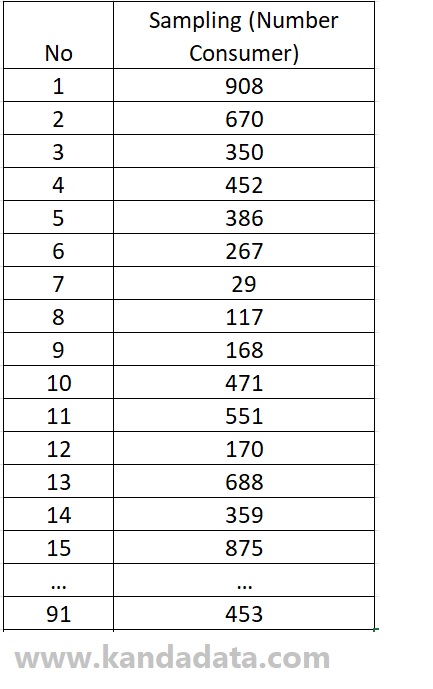
After you click ok, the number of population members selected for the sample will appear. There are 91 population member numbers chosen at random from 1000 consumers. Sampling results can be seen in the image below:
Closing remarks
Based on the sampling results, the number of members of the population selected as the sample was obtained. Because the researcher already has the name of each member of the population, data collection can be carried out directly in the field.
Based on what I have written in the previous paragraph, I can recap that the requirements for using simple random sampling are the availability of a sample frame and homogeneous population data. Furthermore, the data analysis menu in Excel can be used to select a random sample. I hope this article will be useful for all of you. Wait for the next week’s article update!