
Researchers will generally choose the ordinary least square linear regression method if the variable measurement scale is an interval or ratio scale. If the measurement scale of the data is interval or ratio, it is easy to fulfill the possibility of passing the required assumption test.
It is different if the researcher observes the variables measured on a nominal or ordinal scale, where this usually encounters difficulties when testing the required assumptions. For example, when researchers will test the assumption of residual normality.
Variables measured by nominal and ordinal scales are generally not normally distributed. Therefore, when researchers use the OLS regression method that uses non-parametric variables, it does not pass the required assumption test at the normality test stage.
Therefore, researchers who observe variables measured by nominal or ordinal scales should not need to force themselves to choose the OLS method of regression analysis. Researchers can choose other analytical approaches following the characteristics of the observed data. To find out the differences in the nominal, ordinal, interval, and ratio data scales, you can read the previous article entitled: “Nominal, ordinal, interval and ratio scales | Types of Data Measurement.”
On this occasion, Kanda Data will discuss how to use nominal scale variables to be analyzed using the regression approach. As I wrote before, we cannot use the OLS regression method but another regression approach.
The regression approach that can be used is logistic regression. Researchers can use logistic regression, both binary and polynomial logistic regression, according to the characteristics of the data. On this occasion, I will discuss the use of binary logistic regression.
Binary Logistic Regression
Logistic regression is a regression approach that can be used to analyze dichotomous variables measured by a nominal scale. In my previous article, I wrote about using a dummy variable as an independent variable in the linear regression OLS method. You can read my previous article entitled: “How to Use Dummy Variables in Linear Regression with Ordinary Least Square Method”
When the researcher chooses logistic regression, the dummy variable used by the researcher is used as the dependent variable. For example, a researcher wants to observe the effect of the amount of compost production and land area on the farmer’s adoption of organic rice technology.
In this case example, the adoption rate of farmers is the dependent variable. In this case study, researchers do not have to force using the linear regression OLS method.
It is because the dependent variable used is measured on a nominal scale with two categories. Therefore, researchers can use an alternative regression approach called logistic regression.
Because the dependent variable used is measured on a nominal scale with two categories, namely adopting organic rice technology and not adopting organic rice technology, the researcher can choose to use binary logistic regression.
When researchers use binary logistic regression, there are no complex assumption requirements as in linear regression with the OLS method. In logistic regression, it is unnecessary to test linearity, normality, and homoscedasticity. The independent variables do not need to have the same variance, and the independent variables do not need to be changed in the parametric.
Mini research analysis using binary logistic regression
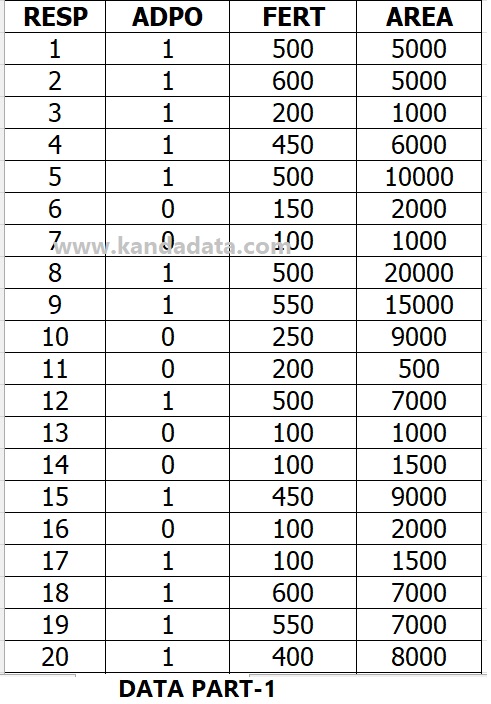
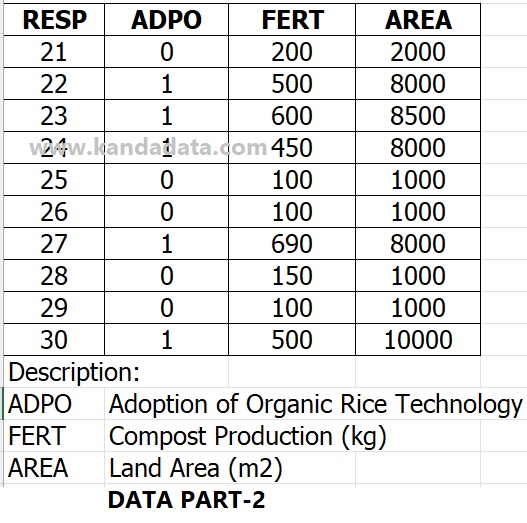
An example of mini research as an exercise material used on this occasion uses cross-section data. A researcher has collected cross-section data from 30 farmers in an area.
The researcher wants to know whether the amount of compost production and land area affect farmers’ decisions in adopting organic rice technology.
The researcher uses three variables, where the dependent variable is a nominal scale with two categories. As for the independent variables, both are measured by a ratio scale.
The researcher wanted to know the influence of the amount of compost production and land area on the adoption of organic rice technology. The researcher decided to use binary logistic regression. The data that researchers have collected can be seen in the table below:
How to conduct binary logistic regression analysis using SPSS
Binary logistic regression can be analyzed using some of your data processing tools. You can use SPSS, SAS, Stata and more.
I will provide step-by-step information on how to test using SPSS. I will write down the steps researchers need to do when conducting a binary logistic regression analysis.
The steps you need to do consist of the following:
1. You can input all variable data you observe directly in the Windows SPSS data view. You can also import data from other applications to import into SPSS.
2. You need to set the view variables in SPSS, including names, variables, labels, and values. You can fill in a value of 0 and be given the label “Farmers do not adopt organic rice technology”. Then you fill in value 1, and the label is filled with “Farmers adopting organic rice technology”
3. You then click analyze -> regression -> binary logistics. Next, you will see the logistic regression window. Move the organic rice adoption rate variable to the dependent box and the compost production and land area variables to the covariates box.
4. Click save to bring up probabilities, group membership, and residuals. You can choose according to your needs.
5. Click the option to display the classification plot, Hosmer and Lemeshow Goodness of Fit, Casewise listing of residuals, correlation of estimates, iteration history and confidence intervals. You can choose according to what you need to explore. Then you click continue and ok.
Interpretation of logistic regression outputs
After conducting a logistic regression analysis, the next step is interpreting the results. The interpretation of binary logistic regression output differs from linear regression analysis using the OLS method.
In principle, the output that needs to be considered in the logistic regression analysis is the pseudo-R squared. Pseudo R Square can be found in the summary model in the binary logistic regression output.
In binary logistic regression, to determine the ability of the independent variables to explain the dependent variable, you can use the pseudo–R Square. In binary logistic regression, the pseudo–R Square consists of Cox & Snell R Square and Nagelkerke R Square. The pseudo-R squared function in logistic regression can be analogous to the same function as R squared in the OLS linear regression method.
Based on the mini research analysis output above, the Nagelkerke R Square is 0.822. This value can be interpreted that the ability of the independent variable to explain the dependent variable is 82.2%. The remaining 17.8% are explained by other variables not included in the binary logistic regression equation.
Researchers can test the model’s goodness of fit using the Chi-square value from the Hosmer and Lemeshow Test. Furthermore, parameter estimation is another important thing that needs to be considered in the interpretation of binary logistic regression.
To determine the magnitude of the influence of the independent variable on the dependent variable in binary logistic regression, you can use the odds ratio value. Furthermore, to determine the significance of each independent variable to the dependent variable, you can look at the P value of the Wald value.
Based on the analysis of the two independent variables used in the binary logistic regression analysis, only the compost production variable significantly affects the adoption of organic rice technology with a p-value of less than 5%.
It is an article that can be written on this occasion. On another occasion, we can discuss how to interpret each output component in binary logistic regression more deeply. Hopefully, this article is useful for all of you. Thank you!
