
Multicollinearity detection is one of the assumption tests that must be performed on multiple linear regression. This assumption test was conducted to obtain the best linear unbiased estimator.
Before giving a tutorial, we need to discuss the multicollinearity test briefly. The multicollinearity test aims to determine whether there is a strong correlation between the independent variables.
An unbiased model is a model that does not has multicollinearity. Therefore, before performing multiple linear regression analysis, you need to do a multicollinearity test.
A multicollinearity test was carried out for the regression equation with at least two independent variables. Therefore, in the multiple linear regression equation, it is necessary to test Multicollinearity first.
Detection of Multicollinearity can be known by doing a correlation test between independent variables. In addition, the most popular multicollinearity detection is looking for the value of the variance inflation factor.
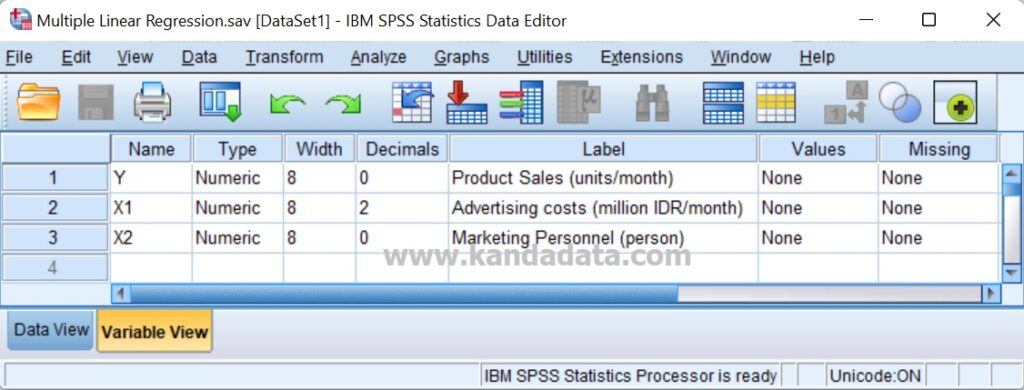
Well, let’s start doing the analysis together. I have inputted three variables consisting of variable product sales (Y), variable advertising cost (X1), and variable marketing personnel (X2). We’ll see more detailed information in the view variables in SPSS as in the image below:
Here, I used multiple linear regression analysis with two independent variables. I want to know whether there is a significant effect on the variable advertising costs and marketing personnel on product sales.
In the multicollinearity test, I will test whether there is a strong correlation between advertising costs and marketing personnel. Well, it’s time for us to do a multicollinearity test.
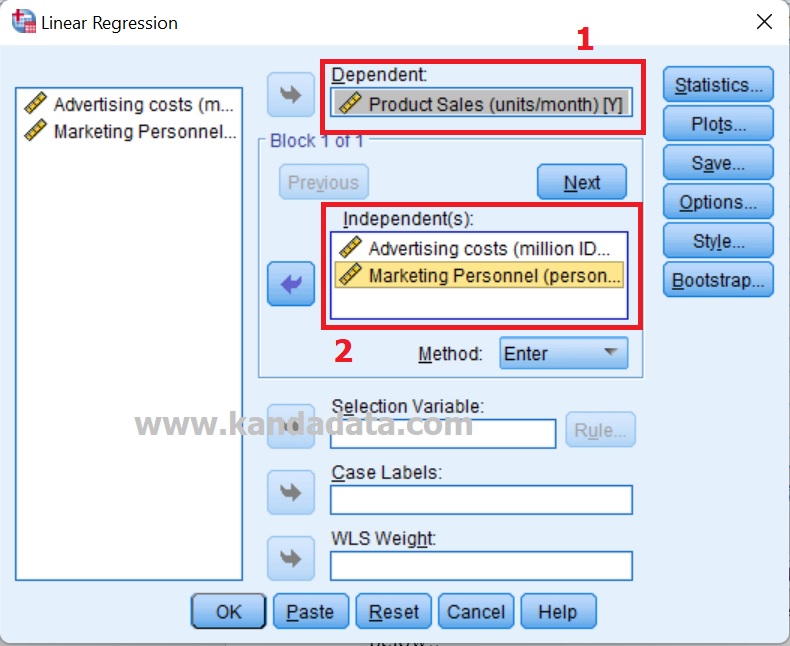
In the first step, you click analyze, click regression, then linear until the linear regression window appears. Move Product Sales into the dependent box. Next, move the advertising costs and marketing personnel into the independent box. as in the image below:
Next, you click statistics. You must enable or check the collinearity diagnostics checklist to bring up the variance inflation factor. Then click continue, then click OK as in the image below:

Next, you see the coefficient table in the SPSS output. Notice in the far right column there is a VIF table as in the image below:

We can see that the VIF value for advertising costs and marketing personnel is 3.567. Thus, the VIF value of 3.567 is smaller than 10. We can conclude that the VIF value is less than 10, meaning that there is no multicollinearity in the independent variables.
For a step-by-step guide to conducting statistical analyses in SPSS, I highly recommend the book Discovering Statistics Using IBM SPSS Statistics: North American Edition, 5th Edition. It’s an excellent resource for mastering statistical techniques and SPSS software.
Well, that’s the video tutorial that I can convey. See you in the following article! I hope it will be beneficial for all of us.
