Tag: Kanda data

Assumptions of Multiple Linear Regression on Cross-Section Data
Multiple linear regression is a statistical technique used to predict the value of a dependent variable based on several independent variables. This regression provides a way to understand and measure the influence of independent variables on the dependent variable.

Assumptions of Multiple Linear Regression on Time Series Data
Multiple linear regression is a statistical analysis technique used to model the relationship between one dependent variable and two or more independent variables. The multiple linear regression model is used to predict the value of the dependent variable based on the estimated values of the independent variables.

Understanding the Profit Formula in Financial Analysis and Examples of Its Calculation
In the business world, achieving optimal profit is a goal sought by entrepreneurs. In financial analysis, knowledge of profit calculation is a fundamental skill that entrepreneurs need to possess.

What to Do If the Regression Coefficient Is Negative?
Linear regression is one of the most commonly used statistical analysis techniques to understand the impact of independent variables on a dependent variable. In regression analysis, the estimated coefficients indicate the extent to which each independent variable affects the dependent variable.
Why Should Data Transformation Be Done Only Once?
Data transformation is an essential step in inferential statistical analysis. It can be a solution to ensure that research data meets certain required statistical model assumptions, such as normality, linearity, and homoscedasticity.
How to Find Residuals Using the Data Analysis ToolPak in Excel
Residuals are the differences between the observed values of the dependent variable and the predicted values from the dependent variable. Residuals are an important measure in inferential analysis, particularly in regression analysis. Given the importance of residuals, we will discuss how to find residual values using Excel.
Analyzing Rice Production Changes with a Paired t-Test Before and After Training Using Excel
Evaluating the effectiveness of extension programs is crucial to ensure that the interventions implemented provide positive impacts for farmers. One way to measure this effectiveness is by comparing production before and after the program using a paired t-test.
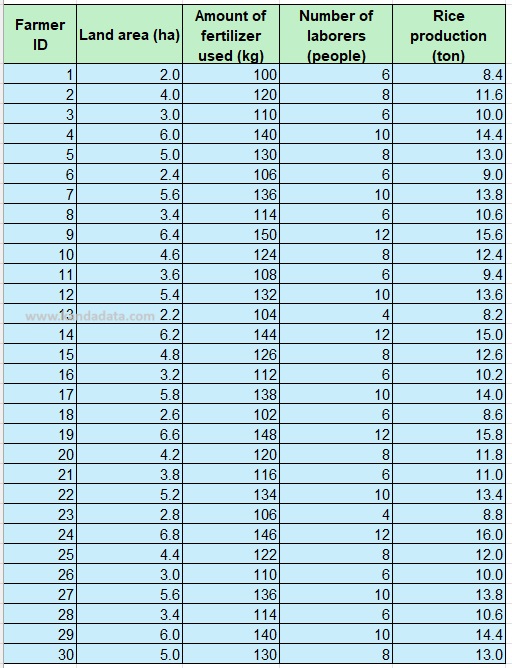
How to Perform Multiple Linear Regression in Excel | Data Analysis Toolpak Tutorial
Multiple linear regression is a statistical method used to analyze two or more independent variables in relation to a dependent variable. In this article, Kanda Data will discuss how to perform multiple linear regression analysis using Excel through the Analysis Toolpak menu.