
Researchers very well know Excel to help research data analysis. So far, excel is mainly used to input data and then present the data in a more informative display. Excel is generally used more for descriptive statistical analysis, creating tables of research results, and creating graphs.
Unfortunately, the use of excel as an inferential statistical data analysis tool has not been fully utilized optimally. Especially for researchers who will use further analysis, such as linear regression analysis for cross-section data or time series data, most of them choose to use other statistical software. Researchers prefer to use statistical software, originally intended as a tool for data analysis. However, it turns out that excel can also be used as an alternative for inferential statistical analysis.
On this occasion, Kanda Data will write from another point of view, and it will be proven that excel is also quite powerful and can be used as an alternative for inferential statistical analysis. Moreover, most laptops, personal computers, and android gadgets currently have Excel installed. Thus, this article will present how to optimize excel as an alternative data analysis tool whose function is the same as the popular statistical software used.
The next question is, how to optimize excel to be used as an inferential statistical data analysis tool? Excel optimization can be done by using the data analysis toolpak in Excel. Then the “Data Analysis” menu will appear on the “Data” tab in the upper right corner of Excel, as shown below:
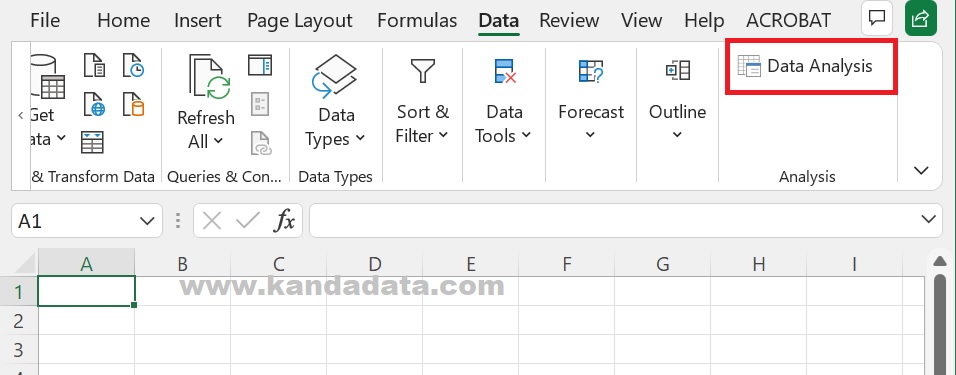
If the “Data Analysis” menu does not appear as shown in the picture, the data analysis toolpak in Excel has not been activated. How to activate the menu is relatively easy and can be done independently. The steps and stages for activating the “Data Analysis” menu in excel can be done by:
1. Open the excel file, then after it opens then, click File -> More -> Options as shown below:

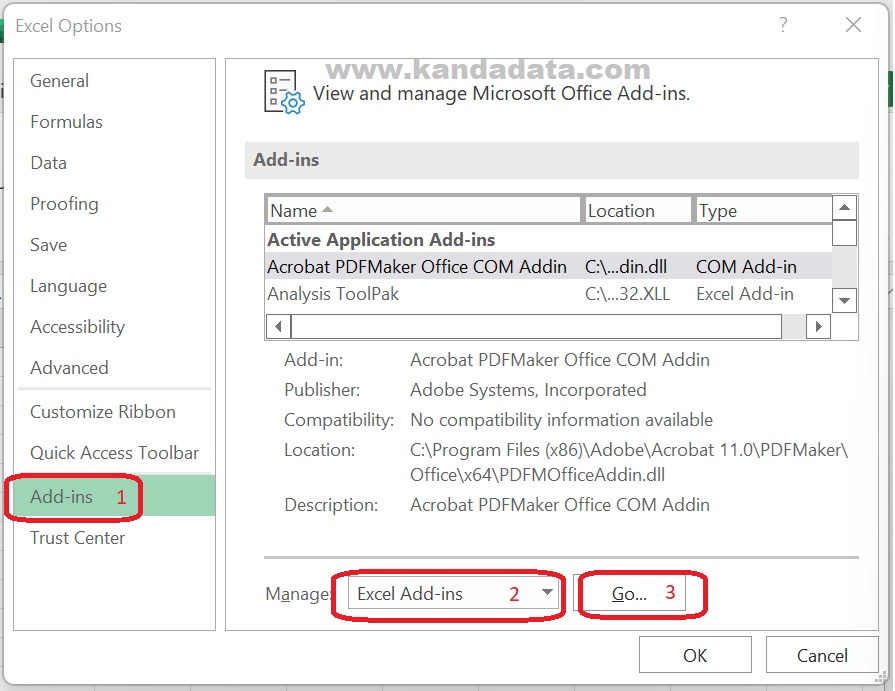
2. Next, the “Excel Options” window will appear. From the various options on the left of the window, please select “Add-ins”. Once clicked, it will appear “View and manage Microsoft Office Add-ins”, and at the bottom, for the “Manage” box, select “Excel Add-ins”, then click “Go” as shown below:
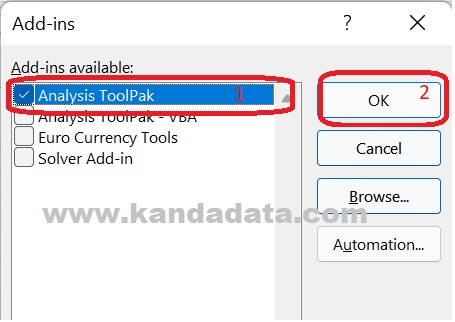
3. The “Add-ins” window will appear. There will be an “Analysis Toolpak” option in the “Add-ins available:” box. Please give a checklist, then click “OK”, as shown in this picture:
4. Now check again on the “Data” tab and check on the top right a “Data Analysis” will appear. If it appears, congratulations! The data analysis menu in excel is active and ready to be used for data analysis.
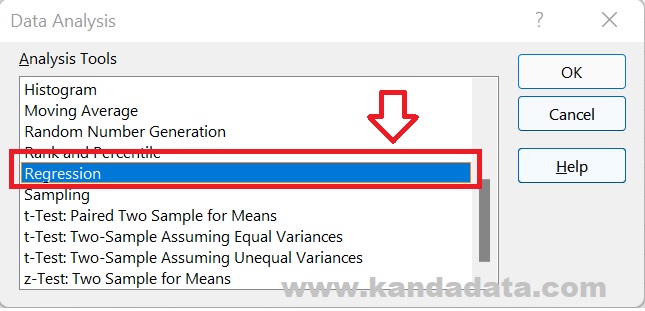
We can perform inferential statistical analysis on the “Data Analysis” menu in excel, such as linear regression for cross-section and time series data through the “Regression” menu. In addition to performing regression analysis, many studies can be done: correlation test, descriptive statistical test, paired and independent sample t-test difference test, z-test difference test, ANOVA, and even sampling can also be done with this menu. The display of the data analysis menu in Excel can be seen in the following figure:
Well, That’s the way how quantitative data analysis is done using the data analysis toolpak in Excel. Hopefully useful for all of you. Wait for article updates next week!
