
Residual values in linear regression analysis can be used to test for normality. In addition, the heteroscedasticity test also requires the variance value of the residual. Therefore, the residual value is important in the linear regression assumption test with the Ordinary Least Square (OLS) method.
The residual is the difference between the actual value of the dependent variable (Y) and the predicted value of the dependent variable (Y’). To calculate the residual value manually, the researcher must first calculate the intercept value and the estimated coefficient of the independent variables.
Calculating the estimated regression coefficient can follow the tutorial in the previous article entitled: “Finding Coefficients bo, b1, b2, and R Squared Manually in Multiple Linear Regression“. The article describes the steps for calculating the intercept and the estimated coefficient of the independent variable manually using Excel.
On this occasion, I will focus on discussing tutorials using the data analysis toolpak in Excel. Based on the analysis tool, I can find the residual value in multiple linear regression more quickly and correctly. As an exercise in finding residual values in Excel, I used a mini-research case study on multiple linear regression using two independent variables.
Mini Research Case Study on Multiple Linear Regression
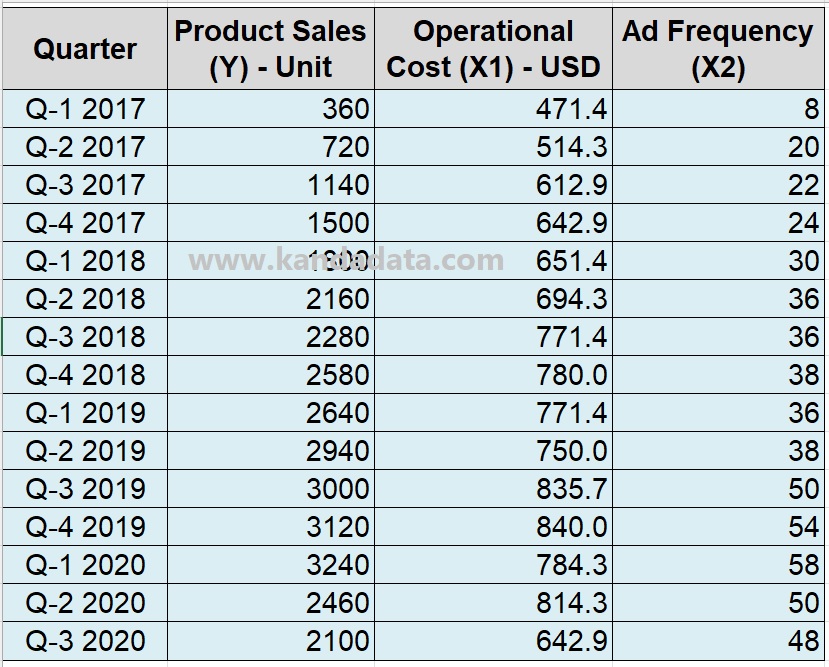
Example of a mini research case on this occasion, I chose a topic regarding observations on product sales variables in a company. Researchers analyze the effect of operational cost and ad frequency on product sales.
The research uses quarterly time series data from the first quarter of 2017 to the 3rd quarter of 2020. There are 15 observational data used in the case examples for this exercise material. The data that researchers have collected in detail can be seen in the table below:
Following the title of this article, Kanda Data will provide a tutorial on how to find residual values in multiple linear regression using Excel. Here, I use the analysis toolpak menu in Excel.
For those who have not found the data analysis toolpak menu in Excel, please read the tutorial in the previous article entitled: “How to Activate and Load the Data Analysis Toolpak in Excel“
Stages for Finding Residual Values in Multiple Linear Regression
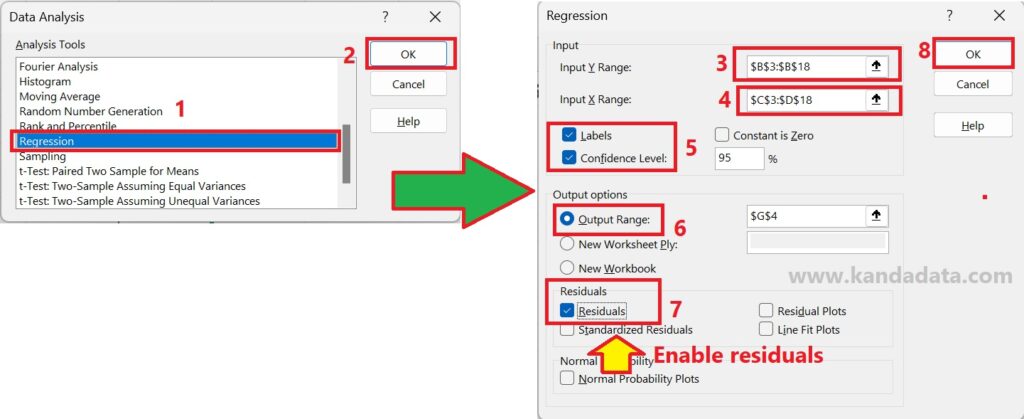
In detail, the steps taken to find the residual value in multiple linear regression analysis are to click “Data” and then click “Data Analysis” in the upper right corner.
After click “Data Analysis”, an analysis tool provided by Excel will appear. In the next step, search for “regression”. Once found, please click “regression” and then click ok.
In the next stage, you will be asked to input the Y variable and X variable. Please input all variables consisting of Y and X data, including the label.
Next, enable “Label” and “Confidence level 95%”. For output options, you are welcome to choose whether to save on the same Excel sheet, new worksheet ply, and new workbook.
Furthermore, this is the most important step to quickly find the residual value in multiple linear regression. You must enable “residuals”, because if you do not do this, the residual values will not appear automatically.
Therefore, ensure you have clicked enable “residuals” so that the residual values can appear automatically under multiple linear regression analysis output. Next, you click ok. The detailed analysis stages can be seen in the image below:
Residual Value in Multiple Linear Regression using Excel
After you have followed the steps I wrote in the previous paragraph and clicked ok, the analysis results will appear. The results of multiple linear regression analysis using Excel will appear in the same format as in the tutorials I have written several times.
If you check at the bottom of the multiple linear regression output, you will find a table with the residual output title. The residual output table appears because we have enabled “residual” at the analysis stage. In detail, the residual output in excel can be seen in the table below:
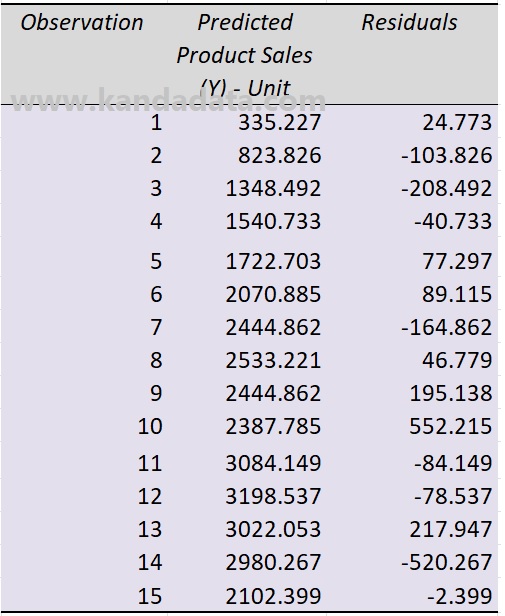
In the residual output table, you will see three columns: observations, predicted product sales, and residuals. Based on these outputs, we have obtained the residual values quickly compared to doing the calculations manually.
This residual value will also be the same as the result of manual calculation, namely the difference between the actual dependent variable value and the predicted value of the dependent variable.
In this tutorial, we can learn that finding residual values in multiple linear regression can be done easily, quickly, and correctly using Excel. It is a tutorial that I can write on this occasion, I hope this is useful for all of you. Thank you!

One thought on “<strong>How to Find Residual Value in Multiple Linear Regression using Excel</strong>”