Statistical hypothesis testing in a study can use the T-statistics in linear regression analysis. The criteria for the acceptance of statistical hypotheses can use a comparison between the T-statistics and the T table or the p-value. Based on the value of T-statistics, a decision can be concluded whether to accept or reject the null hypothesis.
Using these two statistical hypothesis acceptance criteria will obtain the same conclusion. Because of the importance of the T value in linear regression analysis, on this occasion, Kanda Data continues to write the third part of the article, which discusses Calculating Variance, Standard Error, and T-statistics in Simple Linear Regression.
In simple linear regression analysis, calculating the T-statistics must be preceded by calculating the value of variance and standard error. The formula used to calculate the T-statistics requires a standard error value. Furthermore, the variance value is needed to obtain the standard error value. Therefore, it is necessary to calculate the variance first, then proceed with calculating the standard error value and the T-statistics.
To understand how to calculate quickly and correctly, I suggest you first read article part 1 and article part 2, which have been published previously. Part 1 article entitled: “Calculate Coefficients bo, b1, and R Squared Manually in Simple Linear Regression“. Next, for part 2 article entitled: “How to Calculate ANOVA Table Manually in Simple Linear Regression“
How to calculate variance
In simple linear regression analysis only consists of one dependent variable and one independent variable. Therefore, the variance value is calculated using two regression estimation coefficients: variance bo and variance b1.
In calculating the variance value, it is necessary to calculate the value of the estimate of the variance of u first. This value is obtained by dividing the sum of squares of residuals by n-K, in which n is the amount of data or the number of observations used in simple linear regression analysis. In addition, K is the number of variables consisting of the dependent variable and the independent variable.
The residual sum of squares value is obtained from the calculation results in my second article, “How to Calculate ANOVA Table Manually in Simple Linear Regression“. The formula used to calculate the estimate of the variance of u based on the book written by Koutsoyiannis (1977) can be seen as follows:

Based on the calculation results obtained:
Residual sum of square = 52.83468835
n = 10
K = 2
Based on the above formula, the following calculation results are obtained:

Furthermore, the estimate of the variance of u is used to calculate the value of variance b0 and b1. In addition, to calculate the variance, the results of the calculations in part 1 of the article entitled: “Calculate Coefficients bo, b1, and R Squared Manually in Simple Linear Regression” are also needed.
The formula used to calculate the variance bo and b1 is based on the book written by Koutsoyiannis (1977), and the results of the calculation can be seen as follows:

How to Calculate Standard Error
The standard error value in simple linear regression determines the value of T. The greater the value of T, the higher the probability of rejecting the null hypothesis. If the null hypothesis is rejected (accepting the alternative hypothesis), it can be concluded that the independent variable partially affects the dependent variable.
The standard error value is determined by the variance value. A higher variance value will obtain a higher standard error value, otherwise a lower variance value will obtain a lower standard error value. The standard error is also calculated based on standard errors b0 and b1.
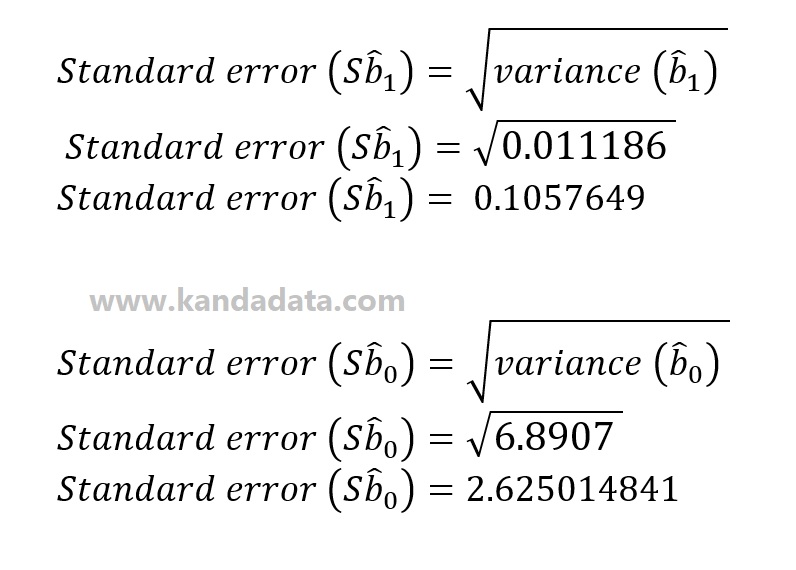
The standard error is obtained from the square root of the variance. In detail, the formula and the results of the calculation of the standard error based on the book written by Koutsoyiannis (1977) can be seen as follows:
How to Calculate T-statistics
To calculate the T-statistics in simple linear regression, T-statistics is calculated for bo and b1. The value of the standard error determines the value of T-statistics. The greater the value of the standard error, the smaller the T-statistics. On the other hand, the smaller the standard error value, the larger the T-statistics will be.
The standard error value is used as a divisor for the estimated coefficient value. Therefore, the standard error needs to be smaller to obtain a large calculated T-statistics. For example, calculating the T-statistics on the intercept coefficient is obtained by dividing the intercept value by the intercept standard error value.
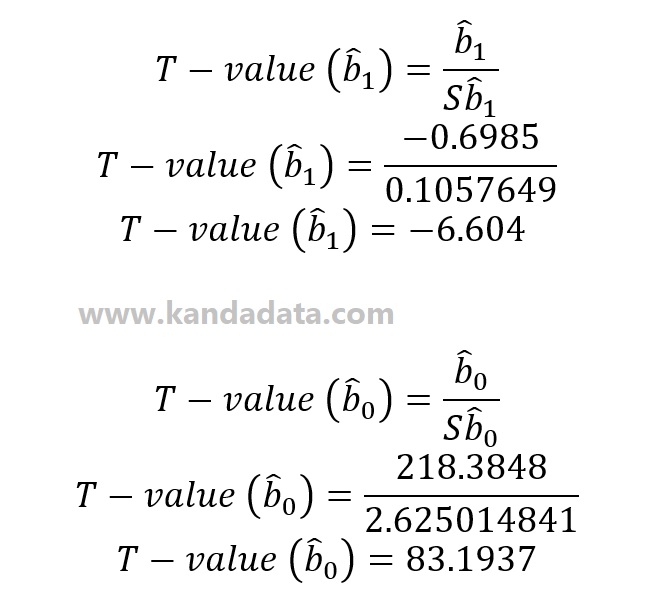
In detail, the formula and results of the T-statistics calculation in simple linear regression based on the book written by Koutsoyiannis (1977) can be seen as follows:
Recheck the calculation results
Based on the calculation results starting from the variance, standard error, and T-statistics, we need to recheck the results of the calculations that have been done. To recheck can be conducted by comparing it with the statistical software output.
Here I will compare the output of a simple linear regression analysis using the data analysis toolpak in Excel. The output of simple linear regression analysis using Excel can be seen in the image below:

Based on the Excel output analysis, it can be concluded that the results of the calculations we have conducted are precisely the same as the Excel outputs. Therefore, we can conclude that the results of our analyses are correct. Master the principles of econometric analysis, including manual calculations in linear regression, with Econometric Analysis. It is a tutorial I can write for you. Hopefully useful for all of you. Check this website regularly for updates on the following article. Thank you!