
The assumption that data must be normally distributed is often a prerequisite for using certain inferential statistical tests. However, sometimes the test results do not meet expectations, indicating that the data is not normally distributed.
There are several methods or approaches we can take if test results show that data is not normally distributed. One approach to address non-normally distributed data is through data transformation.
Data transformation is a technique that involves converting raw data into another form, aiming to approximate a normal distribution. This article by Kanda Data is written to demonstrate whether data transformation can effectively address non-normally distributed data.
Assumptions of Data Normality Tests
As previously mentioned, many inferential statistical tests assume that data must be normally distributed. This assumption ensures that statistical estimates are unbiased.
Several methods can be used to test the assumption of normality. Common statistical tests for detecting data normality include the Kolmogorov-Smirnov test and the Shapiro-Wilk test. These two tests will be used as practice examples in this article.
Data Transformation
Data transformation is the process of converting raw data into another form to reduce skewness and make the data more normally distributed. There are many types of data transformations available.
As researchers, it is essential to understand the characteristics of our data. By understanding the data’s characteristics, we can determine the appropriate type of transformation for our data.
Common types or methods of transformation include natural logarithm transformation, base-10 logarithm transformation, square root transformation, inverse transformation, and other forms of transformation.
In this article, we will use the natural logarithm (Ln) transformation method. In our case study, there are no zero or negative values in the data, making it suitable for natural logarithm transformation.
Case Study and Interpretation
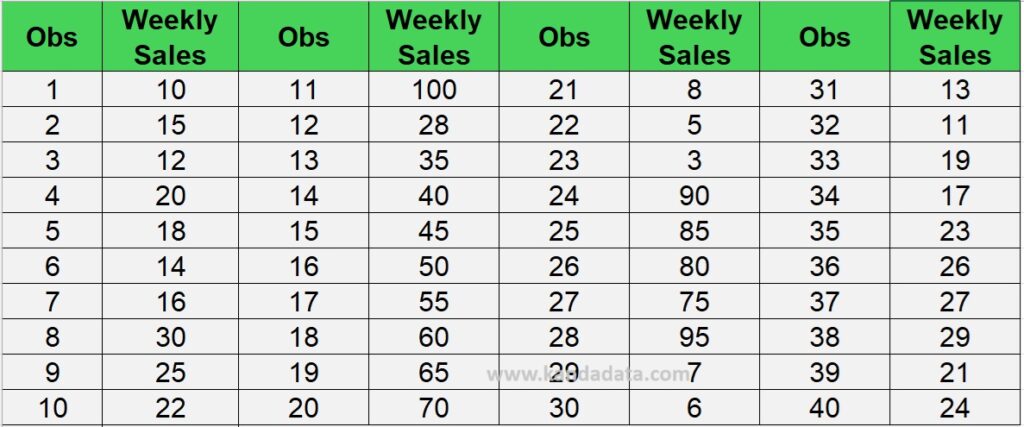
As practice, I have a sample dataset consisting of 40 observations of weekly sales data from several stores. Here is the data before transformation:
Based on the above dataset, I will perform the Kolmogorov-Smirnov and Shapiro-Wilk tests using SPSS. The normality test results using SPSS are as follows:
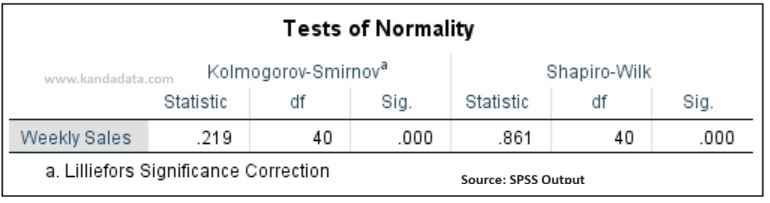
The output shows that the p-values for the weekly sales variable in both the Kolmogorov-Smirnov and Shapiro-Wilk tests are less than 0.05. Since the p-value < 0.05, the null hypothesis is rejected, leading us to accept the alternative hypothesis that the data is not normally distributed.
To demonstrate whether there is a difference after data transformation, I will transform the raw data into natural logarithm form.
The natural logarithm transformation in Excel can be done by typing the formula =LN(data). If using SPSS, click Transform, then Compute Variable, and select Ln. The detailed results of transforming raw data into natural logarithm form can be seen in the table below:
Next, I will re-test the Kolmogorov-Smirnov and Shapiro-Wilk tests using SPSS. The normality test results on the transformed data using SPSS are as follows:
The output shows that the p-value for the Kolmogorov-Smirnov test is 0.200, and the p-value for the Shapiro-Wilk test is 0.447. Both results indicate that the p-value > 0.05, so the null hypothesis is accepted. Since the null hypothesis is accepted, we conclude that the data is normally distributed.
Conclusion
Based on the tests conducted using SPSS, it is proven that data transformation into the Ln form can indeed transform data that was initially not normally distributed into normally distributed data.
Data transformation has made the weekly sales data more normally distributed. This allows us to use statistical methods that assume normality, yielding more valid and accurate results.
This concludes the article by Kanda Data for this occasion. We hope it is useful for those dealing with non-normally distributed data analysis results. Stay tuned for educational article updates next week!
