
The T-statistics in multiple linear regression analysis can be used for statistical hypothesis testing in research. Comparing T-statistics with the T table or p-value can be used to accept statistical hypotheses. T-statistics value can decide whether to accept or reject the null hypothesis based.
An identical result will be obtained by applying these two statistical hypothesis acceptance criteria. On this occasion, Kanda Data continues to write the third part of the article, which discusses Determining Variance, Standard Error, and T-Statistics in Multiple Linear Regression Using Excel.
Computing the variance and standard error must come before calculating the T-statistics in multiple linear regression analysis. A standard error value is necessary for the T-statistics formula. Additionally, the variance value is required to calculate the standard error value. As a result, the variance must first be calculated before the standard error value and T-statistics.
I advise you to read articles part 1 and part 2 first so that you can comprehend how to calculate quickly and accurately. “Finding Coefficients bo, b1, and R Squared Manually in Multiple Linear Regression” is the topic of Part 1 of this article. After that, read part 2 of the article, “How to Manually Find the ANOVA (Analysis of Variance) Table in Multiple Linear Regression.”
How to determine variance value
Multiple linear regression analysis only consists of one dependent variable and at least two independent variables. Therefore, the variance value is calculated using two regression estimation coefficients: variance bo, variance b1, and variance b2.
It is important to first determine the value of the estimate of the variance of u before computing the variance value. By dividing the sum of squares of residuals by n-k, where n is the total quantity of data or the number of observations utilized in the multiple linear regression analysis, one can determine this value. K is also the total number of variables, including both the independent and dependent variables.
The calculation findings in my second post, “How to Find ANOVA (Analysis of Variance) Table Manually in Multiple Linear Regression,” are used to get the residual sum of squares value. Based on the book written by Koutsoyiannis (1977), the formula used to determine the estimate of the variance of u is as follows:

Considering the outcomes of the calculations:
The residual square sum is 193564.6665, n is 15, and K is 3.
The following calculation results are obtained using the formula above:

Additionally, the value of variances b0, b1, and b2 is determined using the estimation of the variance of u. The results of the calculations in part 1 of the article titled “Finding Coefficients bo, b1, b2, and R Squared Manually in Multiple Linear Regression” are also required to determine the variance.
The book written by Koutsoyiannis (1977) provided the basis for the formula used to determine the variance bo, b1 and b2, and the results of the calculation are shown as follows:

How to determine Standard Error
In multiple linear regression, the value of T is determined by the standard error. The probability of rejecting the null hypothesis increases with increasing T values. It is possible to conclude that the independent variable partially influences the dependent variable if the null hypothesis is rejected (accepting the alternative hypothesis).
The variance value determines the standard error value. If the variance is higher, the standard error will be higher; if the variance is lower, the standard error will be lower. Standard errors b0, b1, and b2 are also used to calculate the standard error.
The square root of the variance is used to calculate the standard error. The formula and results of the standard error calculation based on the book written by Koutsoyiannis (1977) can be seen in more detail as follows:

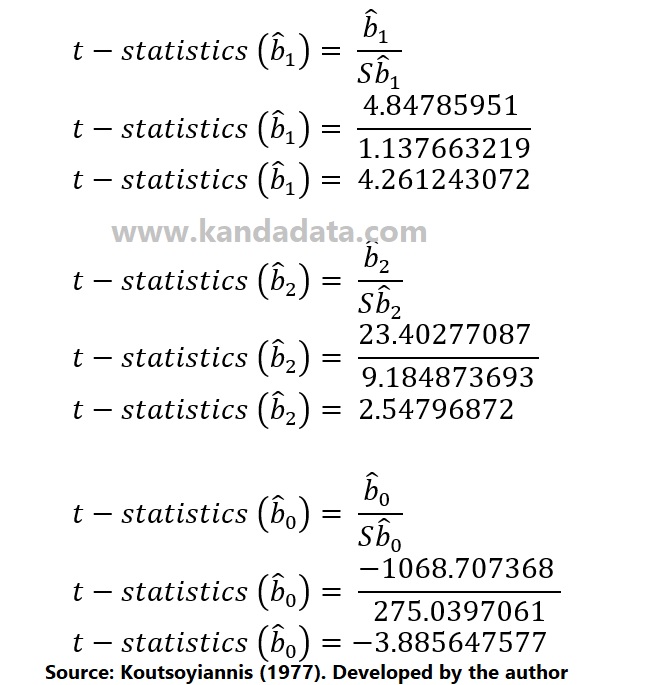
How to determine T-statistics
When using multiple linear regression, the T-statistics are calculated for bo, b1, and b2. The significance of T-statistics depends on the variance value. The T-statistics decreases as the variance value increases. On the other hand, the T-statistics will be higher if the variance is lower. It is because a higher variance will have an impact on a higher standard error as well.
Calculate t-statistics obtained through the estimated coefficient value divided by the standard error value. For instance, dividing the intercept value by the intercept standard error value yields the T-statistics on the intercept coefficient. Therefore, a low standard error is required to calculate a large T-statistic.
In detail, the formula and results of the T-statistics calculation in multiple linear regression based on the book written by Koutsoyiannis (1977) can be seen as follows:
Recheck the calculation output using the data analysis toolpak
We must reevaluate the calculation results based on the results starting from the variance, standard error, and T-statistics. A further check can be conducted by comparing it with the statistical software results.
Here, I’ll compare the results of a multiple linear regression study performed with Excel’s data analysis toolpak. The image below shows the results of a multiple linear regression study conducted in Excel:

The findings of the calculations we conducted are the same as the Excel outputs, according to the study of the Excel outputs. As a result, we could conclude that the outcomes of our analysis are correct. It is a tutorial I can write for you. Hopefully useful for all of you. Thank you!
