
In conducting data analysis, we not only need to know how to analyze and interpret the results, but we also need to understand how to calculate manually. Calculating manually simple linear regression becomes essential, especially for researchers or students deepening econometrics or statistics. Did you know it turns out that doing simple linear regression calculations can be done easily? Manual linear regression calculations can be completed using a calculator or excel.
Because there are still many who need a tutorial on how to calculate simple linear regression manually, on this occasion, I will discuss a tutorial on how to calculate simple linear regression using Excel manually. The tutorial will be discussed in several parts, where this time we will calculate together the estimated regression coefficients. In this article, the calculation of the regression estimation coefficient will be calculated using sample observation (the first method of calculation). I will convey the second calculation method in the following article.
In simple linear regression, we need to know that the number of variables used only consists of one dependent variable and one independent variable. This article will give an example of a case study on the effect of selling price on bread sales. The data used is annual time series data from 2010 to 2019. Bread sales are measured in thousand pieces, and Selling price is measured in USD/unit.
The first thing we need to arrange is to determine the dependent and independent variables. Based on the case study presented in the previous paragraph, this research aims to find out how the selling price influences bread sales. Thus, selling price as a variable that influences us is called the independent variable (given the symbol X). Bread sales as the affected variable is called the dependent variable (given the symbol Y). Furthermore, we can draw up a model specification based on the data collected. The specifications of the model, in detail, we can arrange as follows:

Based on the regression equation above, it means that we have compiled a model specification for a simple linear regression that we will calculate. In this article, we will calculate the intercept (bo) value and the estimated value of the coefficient of the independent variable (b1). For convenience, here I will convey the data that we will use. You can practice using this data, or if you already have your data to process, it will be even better. The data for which the bo and b1 values will be calculated can be seen in the table below:

In calculating the coefficients bo and b1 in this article, they will be calculated using the original sample observation method. We need to do the calculations based on the bo and b1 calculation formulas. The formula used, I refer to the formula in the book written by Koutsoyiannis (1977) as follows:

Based on the above formula, we can choose whether to calculate the intercept value (bo) first or b1 first. The sigma sign in the formula means that we must operate first for all variables, then add up the values. We need to pay attention to calculating each component needed based on the sample observations that we use.
To make it easy for us to operate, we can make a template first using excel. In addition to adding X square and XY in the excel template, we need to add a Sum (sigma) row. We can arrange the template as below:

Calculating X square is relatively easy to do. Our first step is to calculate the value of the X square. We calculate the X square for the first observation by writing the formula =X^2 in excel. The next step is to copy-paste the excel formula for the X square value from the second observation to last.
Next, the XY value is calculated. This calculation is done by multiplying the first observation data for the bread sales variable (Y) and the selling price variable (X). In excel, we write the formula =XY. Next, copy-paste the excel formula for the rest of the following observation data until it’s finished.
To obtain the sigma value, we only need to perform the addition operation for all observations consisting of the Y variable, X variable, X square, and XY. We can write a formula in excel by typing =SUM(…). If you have completed all the calculations, please compare them with the results of the following calculations:

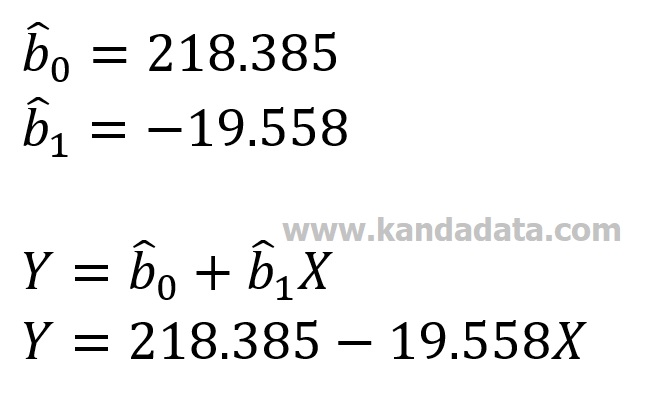
After reaching this stage, all you have to do is perform mathematical operations following the bo and b1 formulas that have been written above. Calculations can be quickly done using excel. The results of coefficients of bo and b1 and the regression equation obtained from the calculation results are:
Up to this point, you have successfully calculated the estimated coefficients of bo and b1 in simple linear regression using excel. You can check the calculation results by comparing them with the analysis results using statistical software.
If you’re looking to deepen your understanding of linear regression concepts and calculations, I highly recommend checking out this comprehensive book on linear regression theory: “Regression Analysis: An Intuitive Guide for Using and Interpreting Linear Models“. It provides clear explanations, practical examples, and step-by-step guides that are perfect for both beginners and advanced learners.
Well, until here first our discussion on this occasion. See you in the following article update! I hope it will be beneficial for all of us.


2 thoughts on “How to Calculate bo and b1 Coefficient Manually in Simple Linear Regression”