
In simple linear regression analysis, the calculation of the predicted Y value, residual value, and sum of squares need to be well understood by researchers. If previously you would usually look at the output of statistical software, on this occasion, I will give a tutorial on how to calculate it manually using Excel.
In the previous article, we have calculated the value of the coefficients of bo and b1 and calculated the value of the coefficient of determination (R squared). In this article, we will also use the same research case example.
We will calculate the predicted Y values, residuals, and sum of squares from an example study using simple linear regression analysis. This research example aims to find out how the effect of the selling price on bread sales.
Difference between Y Predicted, Residual and Sum of Squares
In simple linear regression analysis, we will estimate parameters using available data, both cross-sectional and time-series data. In simple linear regression, based on the estimated coefficients of bo and b1 can be calculated the predictive value of the dependent variable.
In the example case study that we use today, Bread Sales (Y) is the dependent variable. The Y value is the initial observation value. Based on the values from these initial observations, it can be estimated parameters bo and b1.
Furthermore, the estimated value of these parameters is used to calculate the predictive value of each observation. We call the prediction value of each of these observations Y Predicted.
The residual value can be calculated by calculating the Y Predicted value first. The residual value is the difference between the actual Y and the predicted Y. Each observation value from the actual data minus the predicted Y value will produce a residual value.
The Sum of squares can be calculated if the predicted Y and residual values have been estimated. The Sum of squares in regression is divided into regression/model sum of squares and residual/error sum of squares.
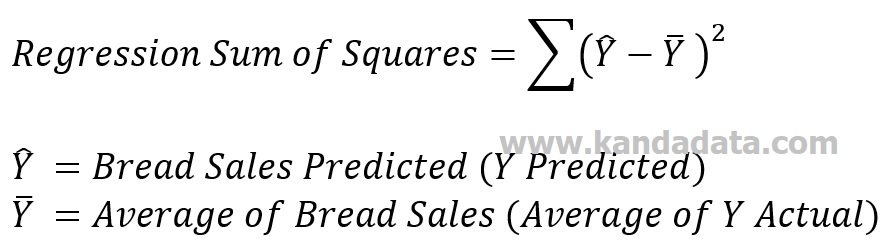
To calculate the regression/model sum of square value, we need first to calculate the difference between the predicted Y and the actual Y average, then squared. Furthermore, the residual value of the sum of squares is calculated by squaring the residual value.
Calculation Formula
Based on what I conveyed in the previous paragraph, we can construct a formula equation to calculate the predicted Y value, residual, and sum of squares. I refer to these formulas from a book written by Koutsoyiannis (1977).
1. Y Predicted Formula
The predicted Y calculation formula can be used from the following simple linear regression equation:

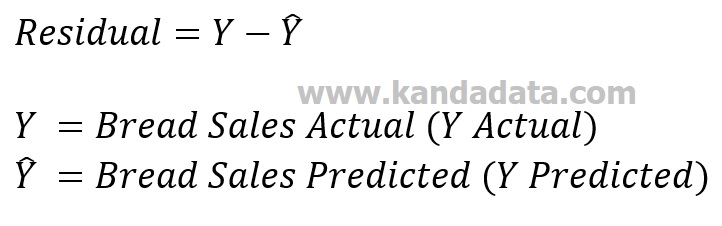
2. Residual Formula
The residual value is calculated by finding the difference between the actual Y value and the predicted Y value, which can be seen in the following equation:
3. Sum of Squares Formula
The regression/model sum of square and residual sum of squares values use different formulas.
a. Regression/model sum of squares
b. Residual sum of squares

How to Calculate Using Excel
The first step to calculate Y predicted, residual, and the sum of squares using Excel is to input the data to be processed. You can use the data in the same research case examples in the previous article, “How To Calculate bo And b1 Coefficient Manually In Simple Linear Regression.”
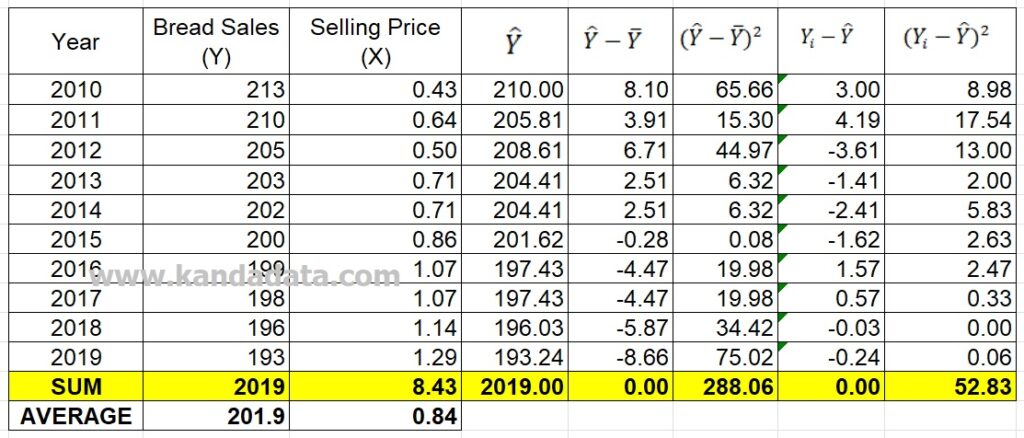
In the second step, you need to create an additional five columns in excel. Please fill in successively with Y predicted, the difference between Y predicted and average Y actual, the difference between Y predicted and average Y squared, the difference between actual Y and Y predicted, and the difference between actual Y and predicted Y squared.
In the third step, add two rows and fill them with Sum and average. Until the third step, you have successfully created a calculation template in excel. For more details, you can see the table below:

The fourth step calculates each component’s value using the equation formula that I have conveyed above. You can compare the results of the calculations with the results of my calculations as in the table below:
Why is it necessary to calculate the Sum of Squares value?
The sum of square value is needed as a component in calculating the F value. The calculation of the F value in the regression uses the analysis of variance (ANOVA) table. The sum of square values must be calculated first in the ANOVA table. Without a sum of squares value, the calculation in the ANOVA table cannot be continued.
Then, the sum of squares value can be calculated if the predicted Y and residual values are calculated. Therefore, the calculation of the predicted Y value, residual, and the sum of squares is related. Want to enhance your econometric skills? Check out Econometric Analysis here.
Alright, here’s the tutorial article that I can convey. Hopefully useful for you. Please wait for the latest article updates from me!


One thought on “How to Determine Y Predicted, Residual, and Sum of Squares in Simple Linear Regression”