
Researchers and practitioners often calculate elasticity to see the response of a variable due to changes in other variables. The measure of the degree of response or the degree of sensitivity is called elasticity. The elasticity value is often used to predict changes in demand or supply of an item due to changes in the factors that influence it.
Therefore, elasticity can be divided into the elasticity of demand and supply. Researchers often calculate the price elasticity of demand or supply. Price elasticity is the percentage change in the quantity demanded of a good due to the percentage change in the price of that good.
The general formula for price elasticity:
Ep = %change in quantity demanded/%change in the price of goods The elasticity value is called elastic if Ep>1, inelastic if Ep<1, and unitary elasticity if Ep=1.
Price Elasticity in Linear Regression
The theoretical price elasticity can be calculated using the formula based on the textbook. Furthermore, how do we calculate the value of price elasticity of demand using research data?
On this occasion, Kanda Data will write How to Calculate Price Elasticity from Linear Regression Equation. Based on the research data, elasticity can be calculated after being analyzed using linear regression. Based on the book written by Koutsoyiannis (1977), the elasticity formula is:
Elasticity = (ΔY/ ΔX) x (Xbar/Ybar)
Based on this formula, ΔY/ ΔX equals the estimated linear regression coefficient. Then Xbar is the average value of the actual X variable, and Ybar is the average value of the actual Y variable. Therefore, to obtain the value of ΔY/ ΔX, a linear regression analysis must be performed first. The average value of the variables X and Y can be directly calculated the average value.
Specification of Linear Regression Equation to calculate elasticity
On this occasion, I will write an example of a mini-research that aims to determine the effect of price on bread sales demand. This research was conducted in Indonesia with the following equation specifications:
Y = b0 + b1X + e
Description:
Y = demand bread sales (thousand units)
X = Price (IDR)
bo = Intercept
b1 = coefficient of estimation of price
e = Disturbance error
The data collected is the annual data for the accumulation of demand for bread sales and the average price. Time-series data were collected from 2010-2019, as shown in the table below:

Calculating Regression Estimation Coefficients in Excel
Following what I wrote in the previous paragraph, ΔY/ ΔX is the same as the estimated regression coefficient. Therefore, it is necessary to perform a linear regression analysis to obtain the estimated coefficient value. On this occasion, I will analyze linear regression using excel.
I will use the data analysis toolpak in excel to perform linear regression analysis. If you haven’t activated the Data Analysis Toolpak in Excel, activate it first. If the data analysis toolpak is active, if you click “Data”, then there will be a “Data Analysis” menu in the upper right corner.
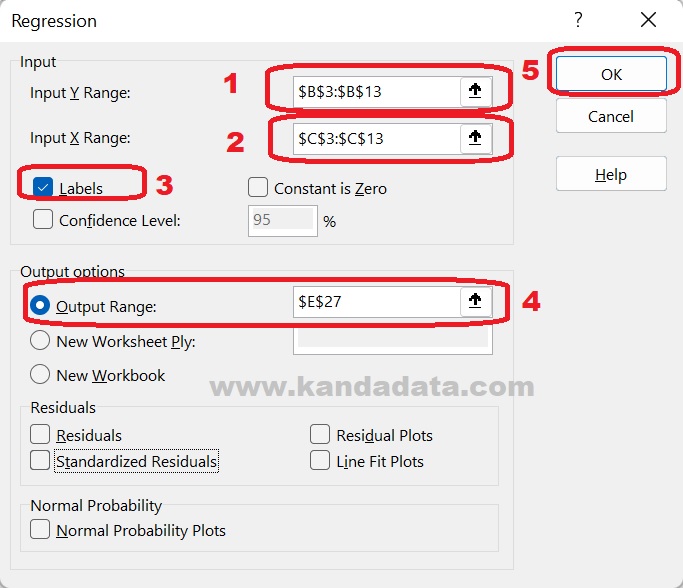
The stages of linear regression analysis are carried out by clicking Data -> Data Analysis -> regression -> Ok. Next, input the Y Range by entering the label and data for the Y variable and the X Range by entering the label and data for the X variable. Next, activate the label and in the output options, select the output location to be displayed. The stages of analysis in more detail can be seen in the image below:
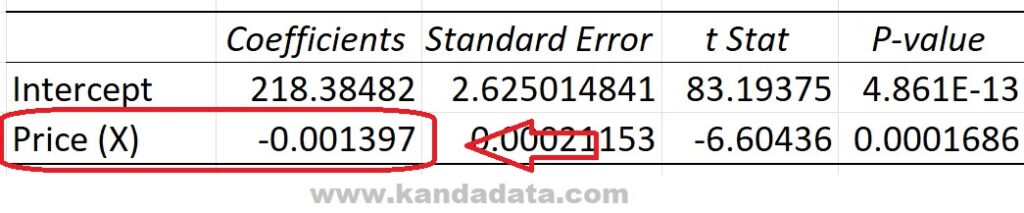
After you click Ok, the analysis results will appear in the predefined output options. The estimated coefficient of the Price variable can be seen in the excel output as follows:
Calculate Price Elasticity from Linear Regression Equation
To calculate the value of price elasticity, after calculating the estimated coefficient value of the price variable, calculate the average value of the actual X and Y variables. To make the calculation easier, I will make a list of components to calculate the price elasticity value as follows:
Price variable regression estimation coefficient = -0.001397
The average value of the actual X variable = 11800
The average value of the actual Y variable = 201.9
Based on the elasticity formula:
Elasticity = (ΔY/ ΔX) x (Xbar/Ybar)
Then the calculation:
Elasticity = (ΔY/ ΔX) x (Xbar/Ybar)
Elasticity = (-0.001397) x (11800/201.9)
Elasticity = -0.0816485
Price Elasticity Interpretation
Based on the value of the calculation of the price elasticity of demand based on the mini-research in this article, it shows that it is inelastic because Ep<1. Based on the value of the inelastic elasticity, it can be interpreted that an increase in the price of 10% means that the demand for bread sales decreases by 0.8165%.
You can calculate the value of price elasticity using the data you have. The price elasticity of demand will vary depending on the data you have. Learn more about econometric methods for calculating price elasticity in Econometric Analysis. That’s an example of calculating the value of price elasticity of demand that I can write for you. Hopefully useful for all of you. Wait for the next article update!
