
The statistical software will also display an ANOVA table in multiple linear regression. To understand well, you need to learn how to determine the ANOVA table manually. In this tutorial, I will use Excel.
In the previous article, I wrote: “How to calculate the analysis of variance (ANOVA) table in simple linear regression.” At this time, I will give a tutorial on determining an ANOVA table in multiple linear regression with two independent variables.
ANOVA table consists of the sum of squares, degree of freedom, mean squares, and F value. Calculating all components in the ANOVA interrelated with each other. These components (sum of squares and degree of freedom) need to be calculated for regression/model and residual/error.
The sum of squares must be calculated first before determining the mean square and F value. To obtain the mean square value, you also find Y Predicted and Residual first. In the ANOVA table, the sum of squares is divided into the regression and the residual sum of squares.
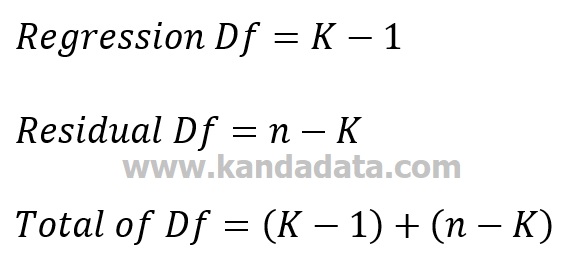
To find the mean square value, you must calculate the degree of freedom (df). The degree of freedom is also divided into two, namely the df of regression and df of residual. Total df is obtained by adding up the two degrees of freedom.
To find the degree of freedom, K is the sum of all the variables used in the model. Furthermore, n is the total number of observations used in the model.
The mean squares are also divided into regression mean squares and residual mean squares in the ANOVA table. The regression mean squares value is obtained by dividing the sum of squares by the degree of freedom.
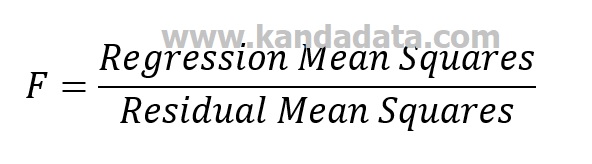
Furthermore, the value of F is obtained by dividing the value of the regression mean squares by the residual value of the mean squares. To test the hypothesis, you need to find the F-table value first.
Formula ANOVA Table using Excel
Based on what I have said before, the complete formula used to calculate the ANOVA Table refers to the book written by Koutsoyiannis (1977), namely:
1. Sum of Squares
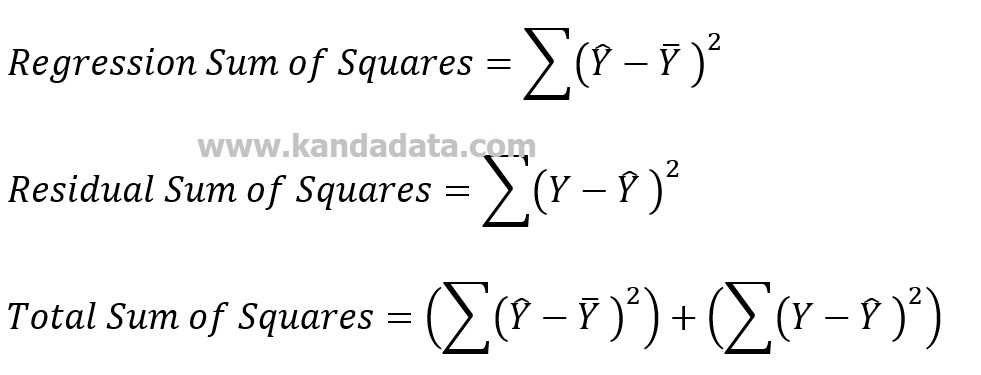
2. Degree of Freedom
3. Mean Squares
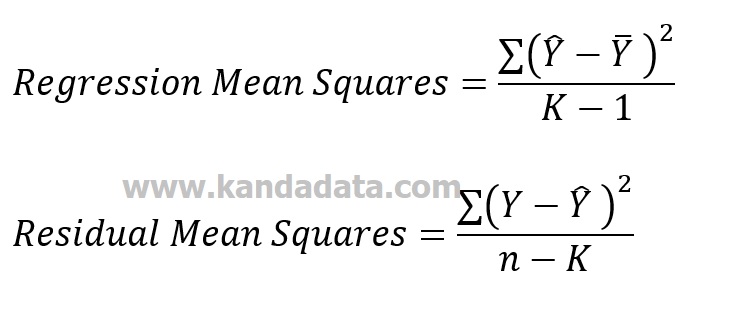
4. F-Test
Exercise on How to Find ANOVA Table
In calculating the ANOVA table, in this article, I use the data from the research sample: “How to Calculate bo, b1, and b2 Coefficient Manually in Multiple Linear Regression.”
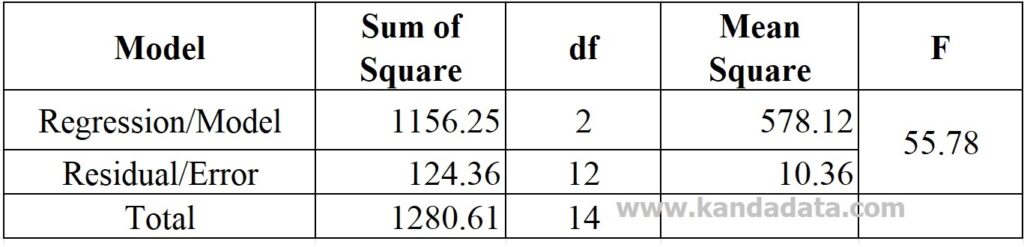
Based on the formulas I have conveyed above, I get an F value of 55.78. In detail, the exercise results of the ANOVA table calculation using excel can be seen in the table below:
You can check the calculation results by comparing them with statistical software output. I have conducted data processing using Excel with the results of the ANOVA table as follows:
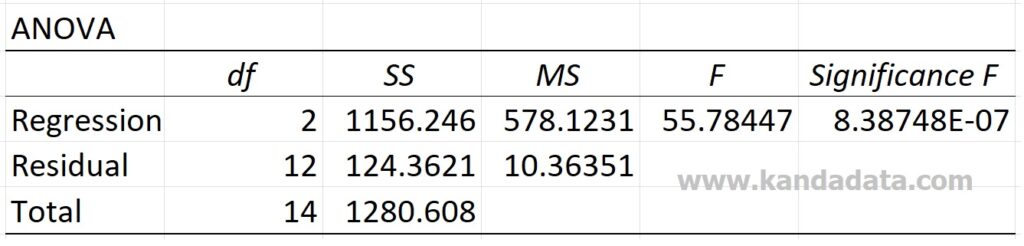
Now, you compare the calculation results. We can see that the results in the two tables above are exactly the same, which means that our calculation results are correct. To gain a better understanding of how to determine and interpret ANOVA tables in multiple linear regression, I recommend the book Regression Analysis: An Intuitive Guide for Using and Interpreting Linear Models.
Well, that’s the video tutorial on finding the ANOVA table in multiple linear regression. See you in the following article!
