
R Square (coefficient of determination) can be used to test the goodness of fit of a regression model. The value of R Square shows how big the independent variable’s ability to explain the dependent variable is. Because of the high benefit of the R Square value, various statistical software outputs will usually display the R Square value.
Understanding how to get an R Square value is important for researchers and students. In a previous article, I wrote about calculating the value of R Square in simple linear regression.
The next question is whether the calculation method is the same as R Square in multiple linear regression? Although the principle is the same, the formula used is different.
In this article, I will discuss how to determine the value of R Square in multiple linear regression. As practice material, the example case that I chose was multiple linear regression with two independent variables.
What is R Square?
R Square (the coefficient of determination) is often used to see how the variation of the independent variable can explain the variation of the dependent variable. A high R Square value indicates a high ability of the variation of the independent variable in explaining the variation of the dependent variable.
On the other hand, the lower the percentage of the ability of the independent variable to explain the variation of the dependent variable, the worse the regression model is. If this is the case, then we need to respecify the model.
To obtain a good model and represent the real world, we are advised to iterate until we get the best model. In the model’s specification, it is better to refer to the theory and empirical experience. Empirical experience can be obtained from relevant previous research results.
The R Square value is between 0 and 1. Generally, research using time series data has a higher R Square value than research using cross-sectional data.
R Square Formula
Calculating R Square in multiple linear regression will be more complex than the R Square formula in simple linear regression. Therefore, this article will make calculations on multiple linear regression with two independent variables.
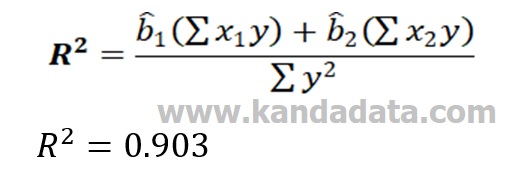
The formula for calculating R Square on multiple linear regression with two independent variables refers to the book written by Koutsoyiannis (1977), which can be seen in the image below:

Based on the above formula, to calculate R Square, you must first calculate the estimated value of b1 and estimated b2. To calculate the estimated value of b1 and b2, you can see the previous article with the title: “How to Calculate bo, b1 and b2 Coefficient Manually in Multiple Linear Regression.”
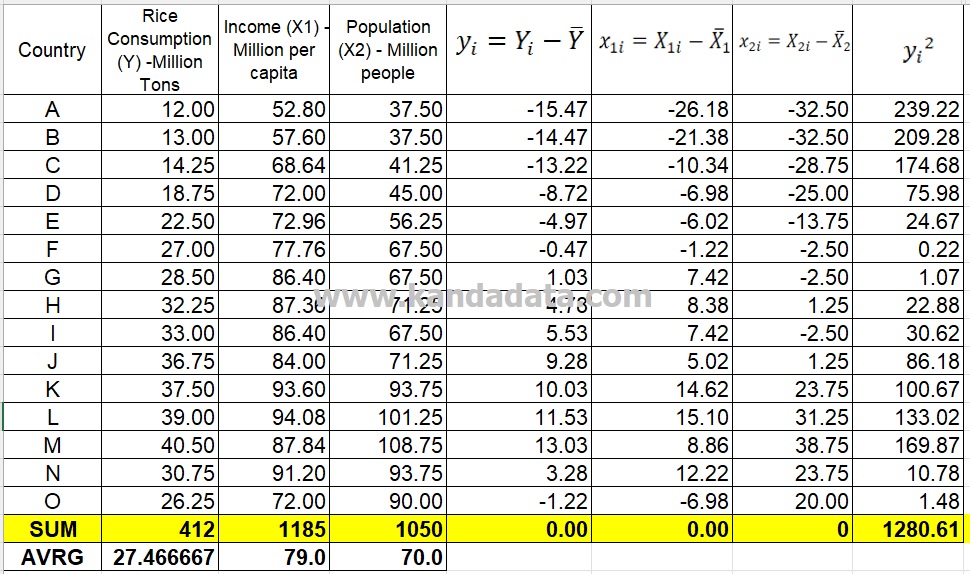
In the previous article, you have calculated the value of the difference between the observed value X and the average value (x) and the difference between the observed values Y and the average value (y).
Exercise How to Find R Square
Excercise how to find R Square on multiple linear regression using the same data as the previous article. The variables used to consist of rice consumption as the dependent variable and income and population as independent variables.
In the exercise, we want to know how the influence of income and population on rice consumption. For more details, you can read the previous article that I wrote: “How to Calculate bo, b1 and b2 Coefficient Manually in Multiple Linear Regression.”
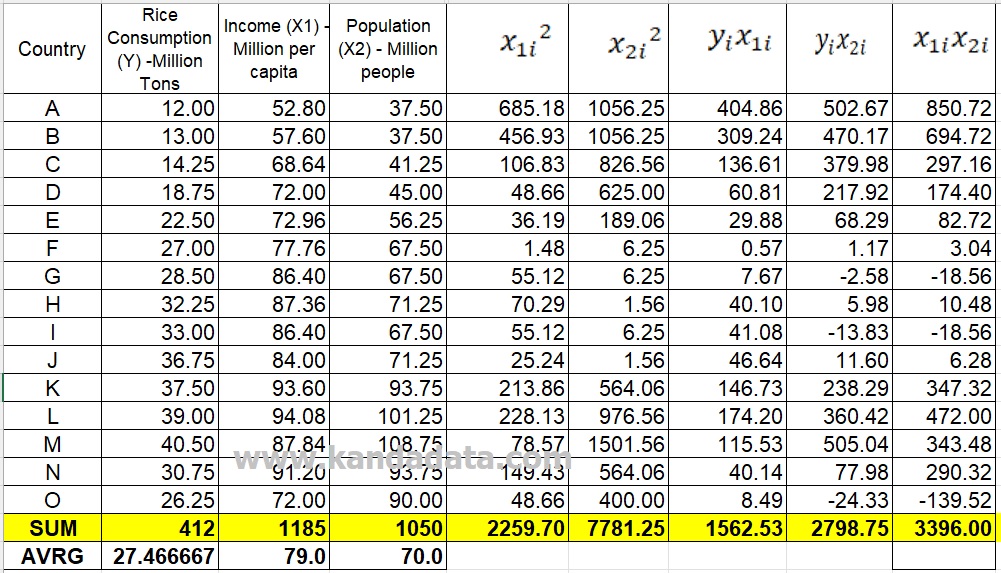
We have all the components needed in the R Square formula based on the article. The components of the R Square formula consist of estimated coefficients b1 and b2, the sum of x1y, the sum of x2y, and the sum of y squared. The results of our calculations in the previous article can be seen in the image below:
Then you can calculate with mathematical operations using the R Square formula. The calculation results that I get are as follows:
R Square Interpretation
Based on the calculation results, the coefficient of determination is 0.903. If you look at the coefficient of determination of 0.903 (the value is close to 1), it shows that the model has good goodness of fit. We can conclude that variations in income and population can explain the variation in rice consumption by 90.3%. The remaining 9.7% is explained by other variables not included in the model.
That’s the article that I can convey this time. I hope it will be beneficial for all of us. See you in the next article!
