
Currently, there are many tools available that researchers can use to help analyze research data. Most researchers are more familiar with using excel in manual calculations in data analysis.
Researchers can also use Excel to perform data analysis, as well as using other data analysis applications. Researchers can use Excel to do some data analysis, such as regression analysis, correlation, t-test, ANOVA, etc.
To use Excel for data analysis, researchers must first activate the Excel data analysis menu. Researchers can easily activate the data analysis menu in Excel.
On this occasion, Kanda Data will share a tutorial on activating the Excel data analysis menu. Kanda Data will provide an example of a t-test case study in this article.
For an example of linear regression analysis using data analysis in excel, please read the previous article entitled: “How to Perform Multiple Linear Regression using Data Analysis in Excel”.
Example of a mini research case study
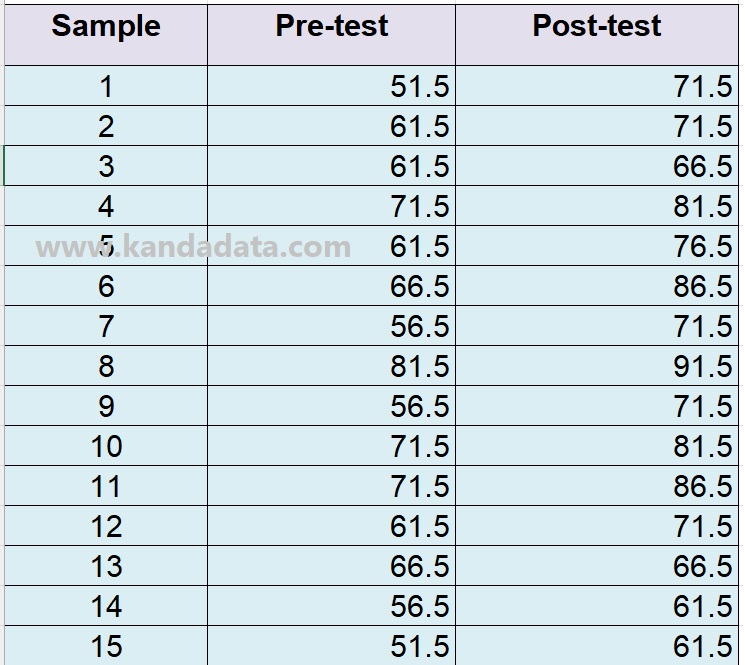
An example of a case study in this article is the application of the t-test. The t-test can be used to determine whether or not there is a significant difference in the mean value of the variable being tested. In this mini-research example, a researcher wants to observe the difference in learning outcomes between applying the existing and new methods.
A pretest was carried out to find out the learning outcomes in the existing method, while to find out the learning outcomes in the new method, a posttest was used. The results of data collection from a sample of 15 people can be seen in the table below:
Checking the Data Analysis menu in Excel
Following the research objectives written in the previous paragraph, the paired sample t-test can be analyzed using Excel. To perform a paired sample t-test, researchers no longer need manual calculations.
Researchers can perform paired sample t-tests using the data analysis menu available in Excel. Before the analysis, the researcher needs to check whether the data analysis menu is available in Excel.
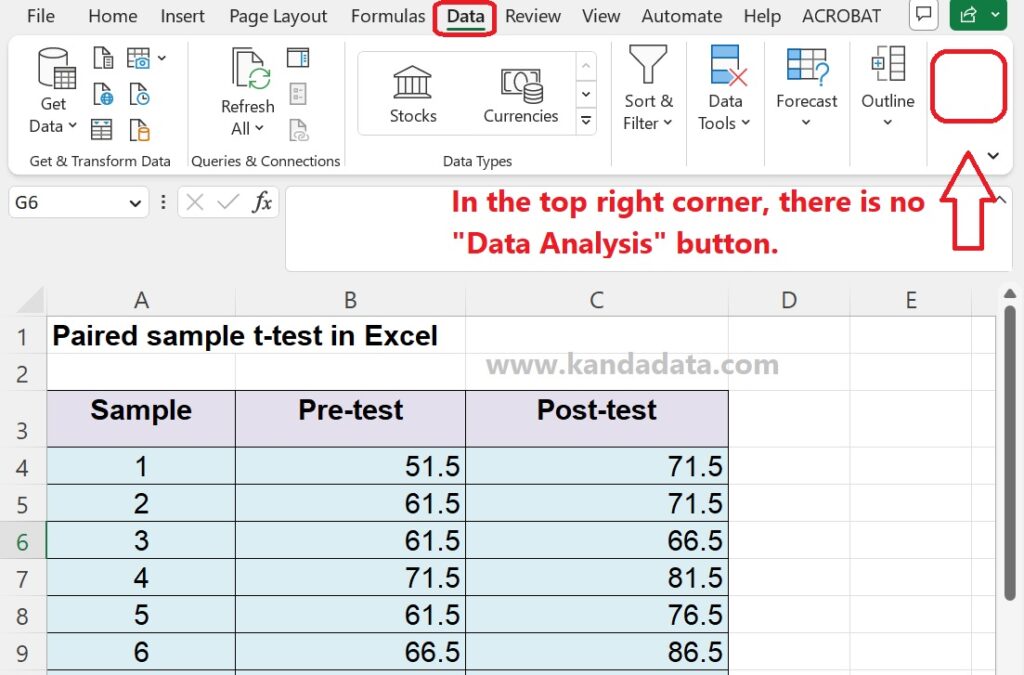
To check it, the researcher opened the Excel file that had been inputted with the research data above. Next, the researcher clicks on data in the upper right corner.
Researchers can check whether a data analysis menu is available in the upper right corner. As shown below, the researcher must first activate the Excel data analysis menu if it is unavailable.
How to Enable Data Analysis Button in Excel
To activate the data analysis menu in Excel, researchers can follow the step-by-step tutorial Kanda Data will write below. First, the researcher opened the Excel file that had inputted the data to be analyzed.
In the next step, researchers click “File”, then based on the options available, and please click “more”, then continue by clicking options. After the researcher clicks on the option, the Excel options window will appear.
There are several options provided in Excel options windows. Researchers can select “add-ins”; information about add-ins will appear when clicked. Next, the researcher goes to the very bottom of the window. At the bottom, please select Excel Add-ins in the Manage section. Next, the researcher needs to click “Go” as shown in the image below:
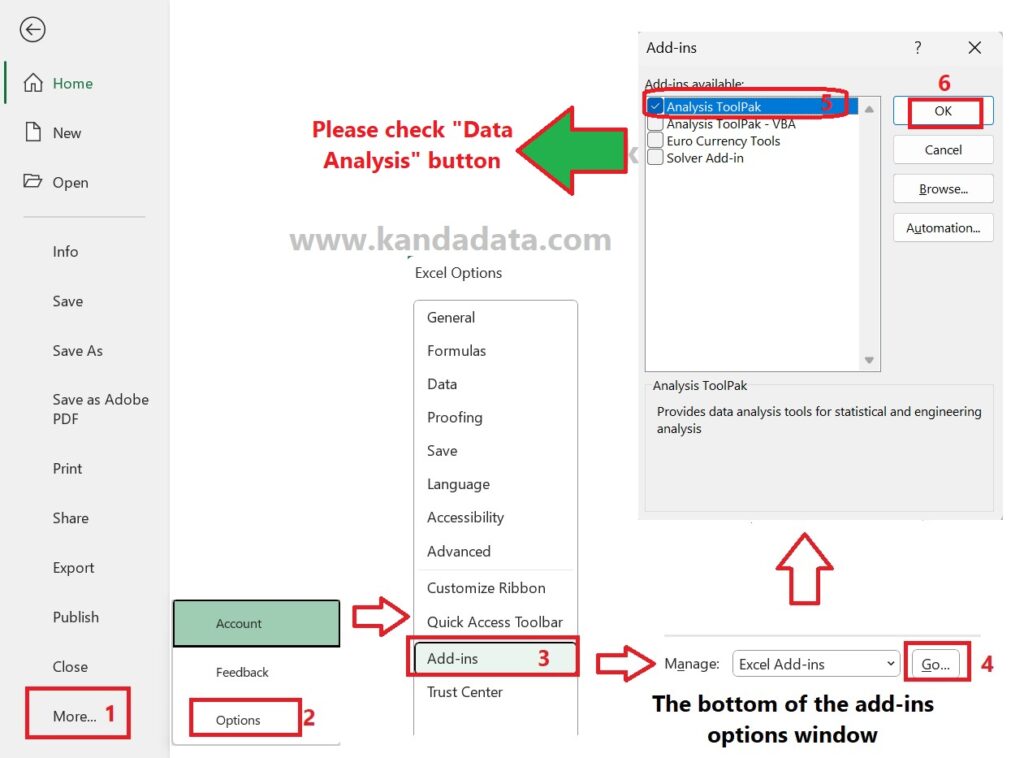
After the researcher clicks Go, the add-ins window will appear. In the default version of the add-ins window, four options are available. The data analysis menu in Excel will be active if the researcher enables the analysis toolpak. Therefore, researchers need to ensure that the toolpak analysis has been checked.
Then the researcher clicks ok, and then the researcher needs to check the data analysis button on the data menu in Excel whether is available or not. If the steps above have been followed correctly, the data analysis button will appear as shown below:

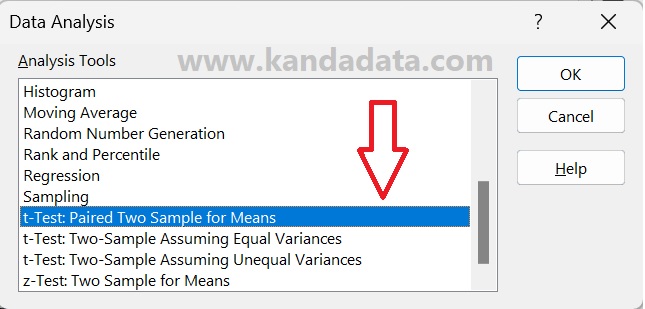
If the researcher has clicked on the data analysis menu in Excel, then several analysis tools provided by Excel will appear in the data analysis window. In accordance with the research objectives above, to conduct a paired sample t-test, researchers can click on the t-test option as shown in the image below:
Based on the picture above, please have the researcher carry out the stages of data input and instructions from the analysis in the test options in Excel. It is a tutorial on activating Excel’s data analysis menu. Hopefully useful for all of you. Wait for the educational article update the following week. Thank you.

3 thoughts on “<strong>How to Enable Data Analysis Button for t-test in Excel</strong>”