
In linear regression analysis, we often want to determine whether the independent variable truly influences the dependent variable. Therefore, linear regression analysis is one type of associative test that aims to determine how the independent variable affects the dependent variable.
When conducting linear regression analysis, we test a statistical hypothesis, where we are faced with the choice of whether to accept the null hypothesis or reject it. If we reject the null hypothesis, we accept the alternative hypothesis.
In the results of linear regression analysis, to test the statistical hypothesis—especially to determine the partial effect of the independent variable on the dependent variable—we use the T-test value.
This test yields a calculated T value (T count), which is then compared to the T-table value as the critical threshold for rejecting or accepting the null hypothesis (H₀). Once we obtain both values, we can conclude whether to accept or reject the previously formulated null hypothesis.
Why is the T-Table Value Important?
Why is the T-table value important? Let Kanda Data explain it in more detail to you. The T-table value serves as a benchmark to determine the significance of a regression coefficient.
From the regression coefficient we’ve obtained, we will decide whether an independent variable has a significant influence on the dependent variable. Here, we also need to determine the confidence interval set in our research.
Returning to the T-table discussion, this value will be compared with the calculated T value. So, how do we draw a conclusion? The criteria are:
If |T count| > T-table, then we reject H₀ (accept the alternative hypothesis, Ha), which means the independent variable has a significant influence on the dependent variable. Conversely, if |T count| ≤ T-table, then we accept H₀, which means the independent variable does not have a significant influence on the dependent variable.
How to Find the T-Table Value in Microsoft Excel
Microsoft Excel provides statistical functions that make it easy to calculate the T-table value without needing a statistics book. Here’s how to use Excel to find the T-table value, both for two-tailed and one-tailed tests:
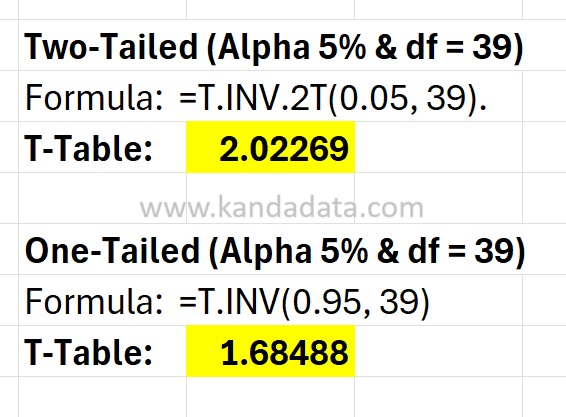
If you want to calculate the two-tailed T-table with an alpha of 0.05 and degrees of freedom of 39, you can use the formula:
=T.INV.2T(0.05, 39)
If you want to calculate the one-tailed T-table with an alpha of 0.05 and degrees of freedom of 39, you can use the formula:
=T.INV(1-0.05, 39)
Here’s an example of how the calculation looks in Excel:
Conclusion
Determining the T-table value is now very easy with Excel. You only need to know the alpha value and the degrees of freedom from your regression analysis. Use T.INV.2T for a two-tailed test, and T.INV for a one-tailed test.
By understanding how to calculate and compare the T count and T-table values, you can make the right decision regarding the significance of the influence of independent variables on the dependent variable in linear regression.
That concludes this article from Kanda Data. Hopefully, it’s useful and provides new insights for you. Stay tuned for more articles from Kanda Data in the future.
