
The coefficient of determination (R-squared) is a statistical metric used in linear regression analysis to measure how well independent variables explain the dependent variable. It indicates the quality of the linear regression model created in a research study.
R-squared has values ranging from 0 to 1. A higher R-squared value indicates that the regression model better explains the variability in the research data. A coefficient of determination value of 0 signifies that the regression model does not explain any variation in the data. Conversely, if the coefficient of determination is 1, it means the regression model explains all the variations in the data.
However, a linear regression model with a high R-squared value may not be a good model if the required regression assumptions are unmet. Therefore, researchers must evaluate and test the required assumptions to obtain a Best Linear Unbiased Estimator (BLUE) regression model.
Example Case Study of Simple Linear Regression Analysis
I will present a case study example to provide a deeper understanding of how to interpret the coefficient of determination in linear regression analysis.
Imagine a researcher who collected time series data from 2012 to 2021. The data gathered consists of two variables: Bread Sales and Price. The researcher wants to understand the influence of bread sales on Price. The detailed data collected by the researcher can be seen in the table below:

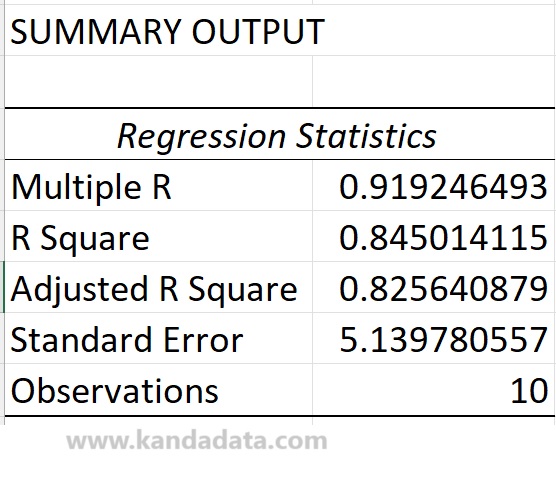
Next, the researcher conducted a linear regression analysis using Excel. The researcher utilized Excel’s data analysis tools. Based on the output of the analysis using Excel, the coefficient of determination values can be observed in the output table below:
The next step is understanding how to interpret the coefficient of determination effectively. This knowledge is crucial for researchers. The example case above assumes that the required assumptions for ordinary least squares (OLS) linear regression analysis have been tested.
How to Interpret the Coefficient of Determination (R-squared)
Based on the table above, it is known that the coefficient of determination (R-squared) is 0.845014115. R-squared can be interpreted as the extent to which the regression model can explain the variation in the dependent variable.
An R-squared value of 0.845 can be interpreted as 84.5% of the variation in the dependent variable being explained by the variation in the independent variables used in the linear regression model.
The remaining 15.5% of the variation in the dependent variable is explained by other variables not included in the linear regression equation. This indicates that an R-squared value of 0.845 suggests that the model can explain the variation in the data.
The Adjusted R-squared value of 0.825640879 indicates the variation in the adjusted R-squared due to the number of independent variables in the model. This value tends to be lower than the R-squared. The more independent variables in the linear regression equation, the lower the likelihood of the Adjusted R-squared value.
Furthermore, further model evaluation is necessary to complete the interpretation of the R-squared value. We need to consider testing the assumptions required in the model, the significance of regression coefficients, and other statistical tests typically used for hypothesis testing.
Alright, this is the article that Kanda Data wrote on this occasion. Hopefully, it will be beneficial and add value to our knowledge. Stay tuned for the next article update from Kanda Data. Thank you.

One thought on “How to Interpret the Coefficient of Determination (R-squared) in Linear Regression Analysis”