
Microsoft Excel is widely popular among researchers for assisting in various data tabulations and analyses. Excel provides a range of basic statistical functions such as mean, median, mode, standard deviation, and other functions for descriptive statistical analysis.
Researchers can also utilize Excel to create graphs and charts, making it easier to visualize research data and present it informatively to readers. You can create bar graphs, line charts, pie charts, and other types of graphs to communicate research findings effectively.
In addition to being powerful for conducting descriptive statistical analysis, Excel can also be employed for inferential statistical analysis. For instance, you can perform regression analysis, correlation analysis, hypothesis testing, and other tests using Excel.
However, to utilize these inferential statistical analysis features, you need to activate the Data Analysis tools in Excel first. In this tutorial, Kanda Data will guide you through the process of enabling the data analysis tool for statistical analysis in Excel.
Step-by-Step Tutorial: Activating the Data Analysis Tool in Excel
Step 1: Open the Excel application and the worksheet where you want to activate the Data Analysis tools. Next, click on the “Data” tab at the top of the Excel window.
Step 2: On the right-hand side of the “Data” tab, you will see the “Data Analysis” option if it has already been activated. If it’s not activated, the “Data Analysis” option won’t appear on the top-right.
Step 3: To activate the Data Analysis Tools in Excel, click on “File,” then select “More,” and finally click on “Options.” Here’s a detailed breakdown of this step, as shown in the image below:

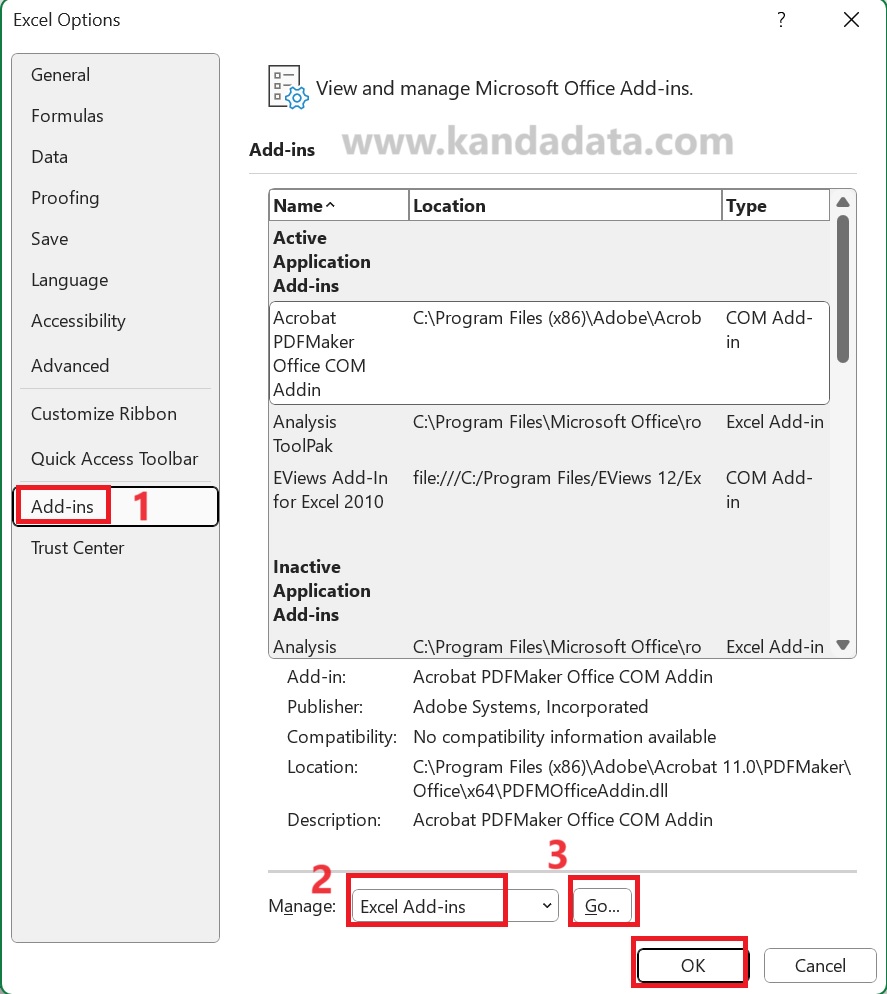
Step 4: A window titled “Excel Options” will appear. On the left-hand side of this window, select “Add-ins.” Then, at the very bottom, in the “Manage” box, choose “Excel Add-ins.” Afterward, click “Go,” as illustrated in the image below:
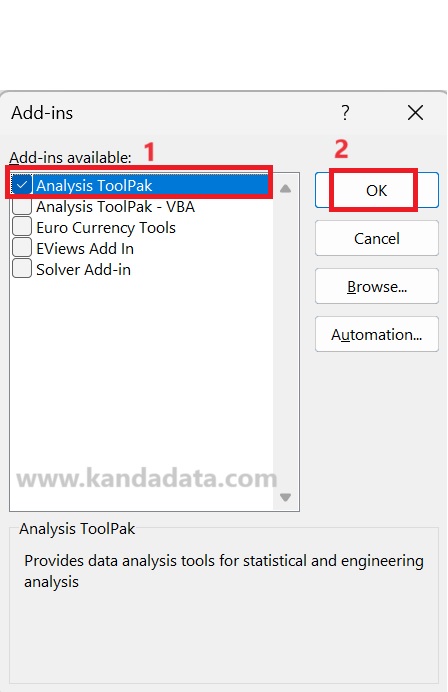
Step 5: After clicking “Go,” a window titled “Add-ins” will appear. Among the various options, enable the “Analysis Toolpak” and then click “OK.” You can see this process in detail in the image below:
Now, the Data Analysis ToolPak is activated. You can proceed to select the type of statistical analysis you want to perform from the available list and fill in the required parameters for your chosen analysis.
Options for Inferential Statistical Analysis Provided by Excel
Excel’s Data Analysis ToolPak offers several options for inferential statistical analysis that researchers can use to analyze their research data.
Researchers can perform various types of analyses, such as regression to understand the relationships between variables, hypothesis testing to assess assumptions about data, analysis of variance (ANOVA) to compare group means, and correlation analysis to evaluate associations between variables.
Additionally, basic statistical analyses like calculating means, medians, and modes are also available. This tool encompasses clustering analysis, histogram creation, and other tests.
With its wide range of available options, Excel serves as a highly valuable tool for researchers in conducting data analysis, both in descriptive and inferential statistics.
Well, that wraps up the article for today. We hope it proves useful and provides solutions to those in need. Stay tuned for more educational articles from Kanda Data. Thank you!
