
Researchers often use the natural logarithm form (Ln) transformation. In the previous article, I have written about How to Transform Data into Natural Logarithm (Ln) in Excel.
For those who haven’t read it yet, you can open the article entitled: “How to Transform Data into Natural Logarithm (Ln) in Excel.” Based on this article, we can easily transform data into natural logarithms.
However, sometimes when conducting data analysis, we may focus too much on using the transformed data. Whereas in descriptive analysis, we need initial data before the transformation.
Suppose you have already transformed research data into a natural logarithm (Ln) and do not have good data storage management. Maybe, you might not be able to access the initial data of your research.
It could be because you are in a hurry to save the transformed file without backing up your initial data. Perhaps, you have a problem with your computer that you lose access to the initial data of your research.
Kanda data, on this occasion, provide a solution regarding how to reverse natural logarithm to initial data in Excel. The method is also very easy as we do the initial data transformation into natural logarithmic form in Excel.
To make the exercise easier, I will use an example of a research case entitled: Effect of income and population on rice consumption. The variables used consist of one dependent variable (rice consumption) and two independent variables (income and population). The data from the transformation into the natural logarithm (Ln) can be seen in the table below:
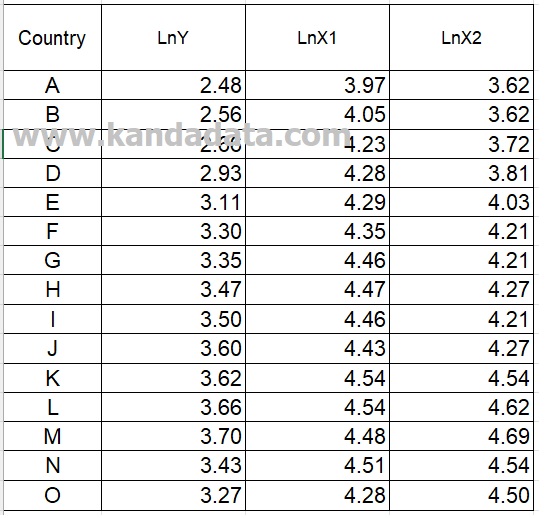
In the first step, you create 3 additional columns in Excel and write the labels with Rice Consumption (Y) -Million Tons, Income (X1) -Million per capita, and Population (X2) – Million people, respectively. Then you write the formula as follows:
=EXP(…)
=EXP(first data from variable LnY)
=EXP(2.48)
=12.00
In more detail, you can see in the image below:
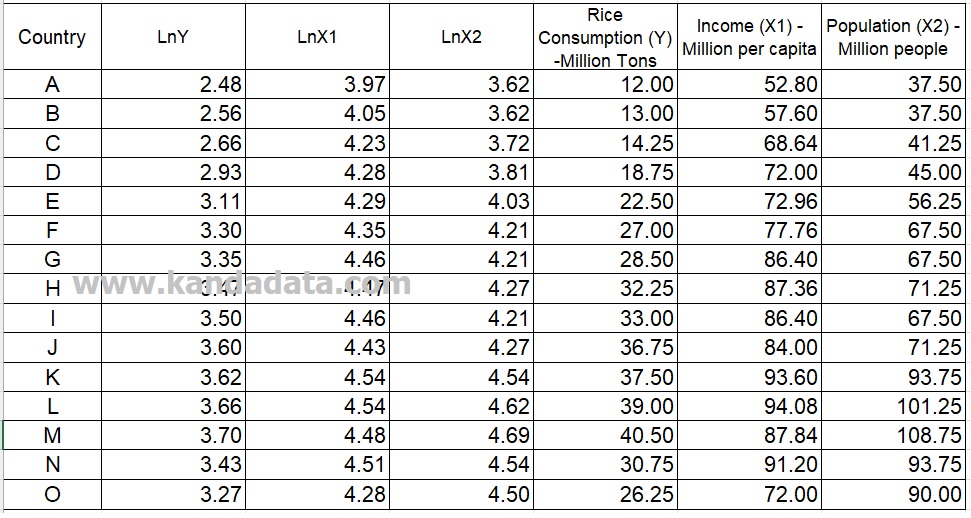
Based on the calculations using the excel formula, the reverse of the Ln result of 2.48 is 12.00. Next, you copy-paste the formula up to the last of the LnY variable. In the same way, you transform it for the LnX1 and LnX2 variables.
The results of the reverse of natural logarithm data into the initial data that I have finished can see in the table below:
For a clear and intuitive explanation of statistical concepts, I recommend the book Introduction to Statistics: An Intuitive Guide for Analyzing Data and Unlocking Discoveries. This guide is perfect for mastering data analysis techniques with ease.
Well, that’s all I can convey about how to reverse natural logarithm to initial data in Excel. I hope it will be beneficial for you. See you in the next article!
