
Research data need to be analyzed to obtain the required information. We can choose various data analysis techniques according to the purpose of data analysis.
In general, we can divide the data into three, namely cross-section data, time-series data, and panel data. We get cross-section data from the field according to the purpose of data collection.
The cross-sectional data consists of many objects measured in one time period, for example, farmers, companies, consumers, etc. Meanwhile, time-series data consists of one object measured over several periods, for example, consumption, income, & production data in the last 20 years.
Data involving many objects but measured over several time periods can be called panel data. For example: company profit in area ABC measured over 5 time periods. Furthermore, panel data is a combination of cross-section data and time-series data.
Difference between Data and Information
If we have not analyzed the data, obtaining the required information will not be possible. Therefore, the data needs to be analyzed first to get the necessary information.
Furthermore, we can distinguish between data and information. Data has a more detailed and technical scope, while information produces explanations that can be used to make decisions.
In the context we discuss this time, it can be underlined that data differs from information. The data that has been analyzed can produce information according to the characteristics of the data.
Data Input and Data Tabulation
In the data analysis stage, the researchers’ initial step is to input and tabulate the data. Data tabulation can use cross-section data, time-series data, or panel data.
When the data has been inputted, we can analyze it to produce information. Sometimes, we are required to immediately provide initial information from the input data, especially if we are asked to sort the values from highest to lowest.
If the inputted data is in the tens or hundreds, it will not be a problem. If the input data is in the thousands? We need to consider a quick way that sorting values can be done with the help of a computer.
Filter menu settings in Excel
A computer can quickly assist in sorting the values from the highest to the lowest value. To do this task, we can use Excel.
We can perform data sorting in one of the existing facilities in the excel application. In sorting data, we can easily sort the values from highest to lowest.
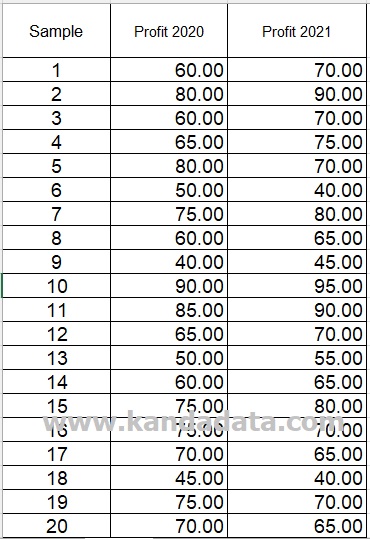
On this occasion, Kanda Data provides an example using profit data from 20 companies. Profit data is obtained in 2 time periods, namely profit in 2020 and profit in 2021, as can be seen in the table below:
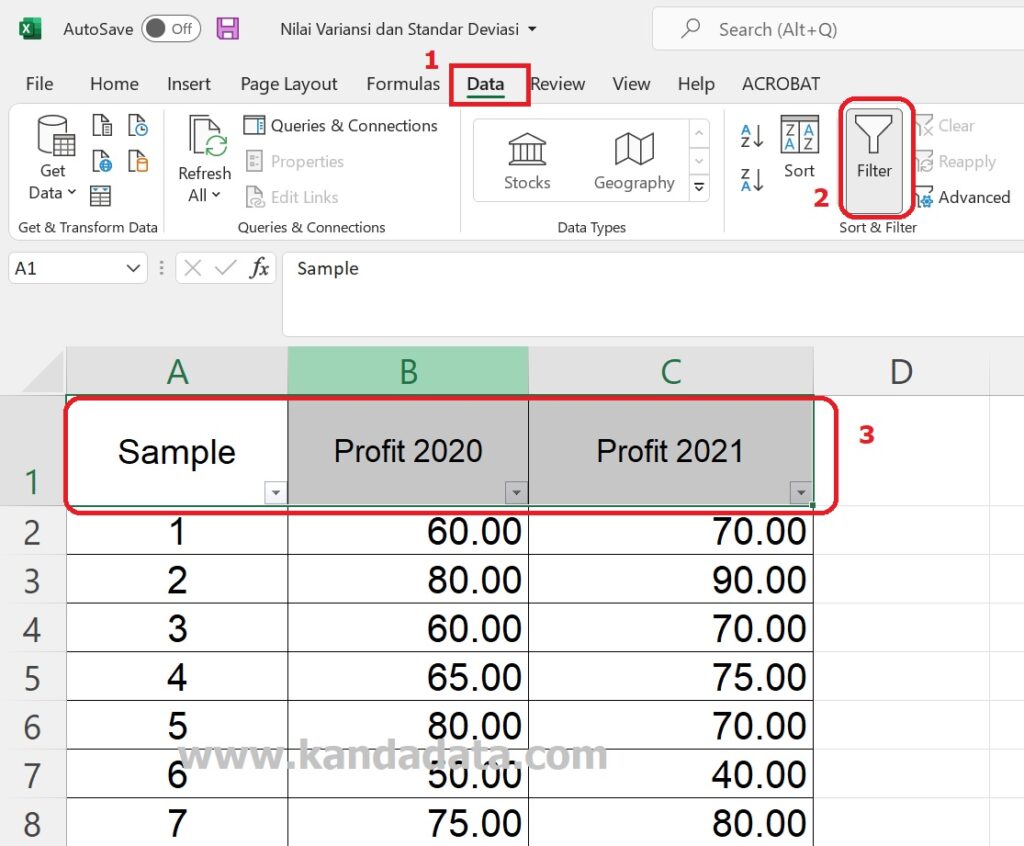
The next step is setting the filter menu in excel. You block variable labels and then click the Data menu in excel. From the available options, please select a filter as shown below:
How to sort data from the highest value to the lowest value
After successfully setting the data filter menu in excel, you can immediately sort the highest to lowest values automatically using excel.
The trick is that you need to click the triangle sign pointing downwards until the image below appears:
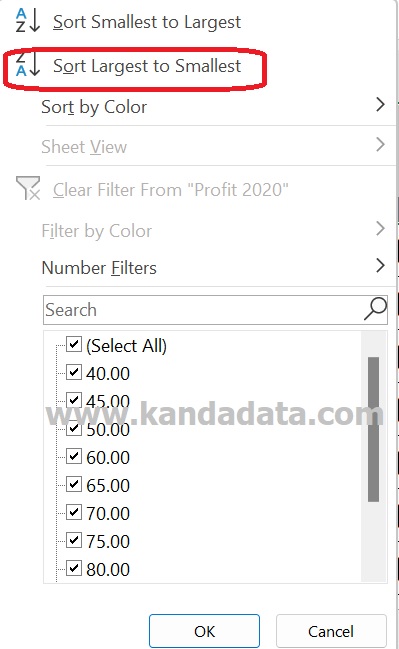
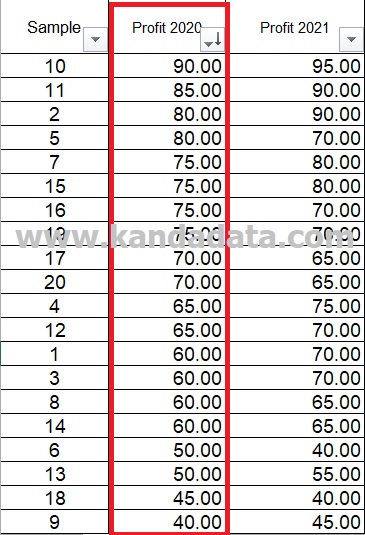
Then you click “Sort Largest to Smallest”, and the data will automatically be sorted from the highest value to the lowest value. The results of sorting profit values for 2020 can be seen in the image below:
Well, I hope this tutorial is helpful for all of you. For a deeper dive into advanced Excel techniques, including sorting and data analysis, I highly recommend the book Microsoft Excel Data Analysis and Business Modeling (Office 2021 and Microsoft 365). This comprehensive guide is perfect for mastering Excel for business and analytical tasks. See you in the following article!
