
In parametric statistical analysis, several assumptions must be met, one of which is the assumption that data should be normally distributed. However, in practice, the data obtained from research does not always follow a normal distribution based on statistical tests. Therefore, some researchers attempt to adjust the distribution of data to make it more closely resemble a normal distribution. One common method is data transformation. Among various types of data transformations, the natural logarithm transformation is one of the most commonly used.
This raises the question: Is it true that applying a data transformation can improve the distribution of the data? Can a data distribution that is initially skewed to the right become normally distributed after transformation? Let’s try to verify this through a case study discussed in this article.
Normality Test on Sales Volume Variable
As the case study for this article, I will present an example dataset consisting of 15 branch stores located in region ABC. From these 15 stores, we recorded the monthly car sales volume. The detailed data for the monthly sales volume from these 15 stores is shown in the table below:
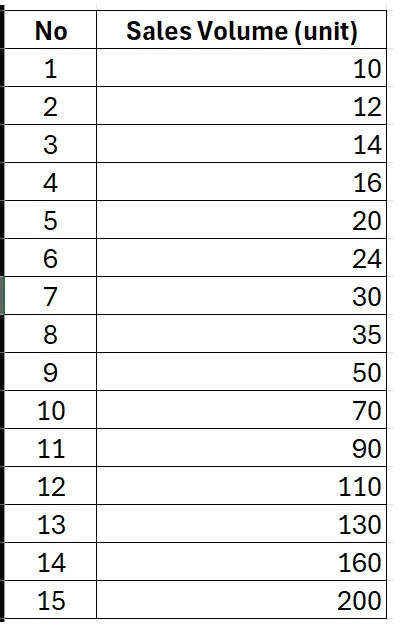
Based on the table above, it can be observed that the sales volume variable falls under the ratio scale category. Variables measured on a ratio scale typically have a greater potential to follow a normal distribution. Nevertheless, it is essential to conduct a normality test for this variable.
To test whether the data follows a normal distribution, I used SPSS software. In SPSS, I used both the Shapiro-Wilk test and the Kolmogorov-Smirnov test. The steps are as follows: click Analyze, then click Descriptive Statistics, followed by Explore. Insert the sales volume variable into the Dependent List box, then click Plots, and check the Normality plots with tests option. I then ran the normality tests in SPSS, and the output can be seen in the image below:
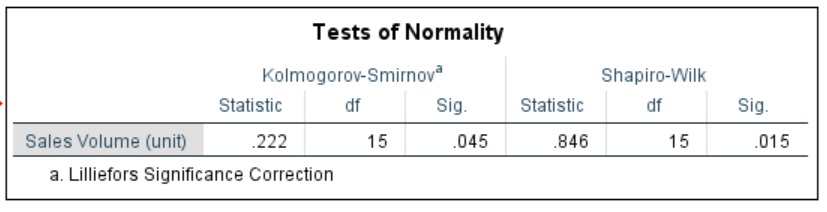
According to the image above, the Kolmogorov-Smirnov test shows a p-value of 0.045, and the Shapiro-Wilk test shows a p-value of 0.015. Both tests indicate that the p-values are less than 0.05. Since the p-value is below 0.05, we reject the null hypothesis. With the rejection of the null hypothesis, we accept the alternative hypothesis, meaning the data is not normally distributed.
Okay, based on the example above, we can conclude that the data is not normally distributed. Now, let’s try performing a natural logarithm transformation on the data.
Natural Logarithm Data Transformation
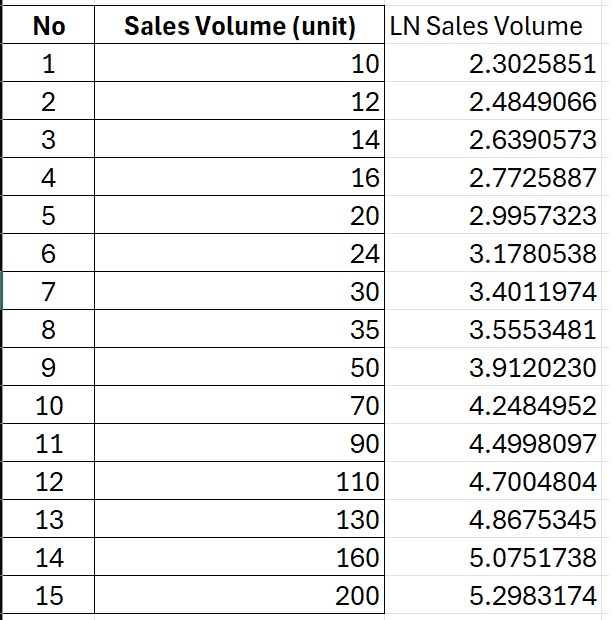
Among the various data transformation techniques used by researchers, the natural logarithm transformation is quite popular. To transform the sales volume variable into its natural logarithm form, we can easily do this using Excel. The method is simple: just type the formula =LN(…) and apply it to each sales volume data entry. You can then copy and paste the formula so that all sales volume data is converted into natural logarithm form. The transformed data can be seen in the table below:
Normality Test Using Transformed Data
Once we have transformed the sales volume data into natural logarithm form, we re-run the normality tests using the same procedure described earlier with SPSS. The results from SPSS can be seen in the image below:
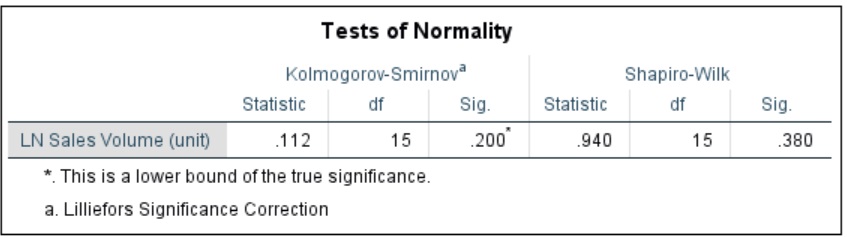
Based on the image, it can be observed that after transforming the data into natural logarithm form, there is a change in the p-values. The Kolmogorov-Smirnov test now shows a p-value of 0.200, and the Shapiro-Wilk test shows a p-value of 0.380.
These results confirm that the p-values have increased to values above 0.05 in both tests. Since the p-values are greater than 0.05, we accept the null hypothesis. Therefore, it can be concluded that the transformed variable, natural logarithm of car sales volume is now normally distributed.
Important Considerations
When data transformation results in a normal distribution, the assumption of normality is considered fulfilled. However, since the data has been transformed, researchers must exercise caution when interpreting the results. This is because the data being analyzed is no longer the original data, but the transformed data. Thus, interpretations should focus more on the significance of the relationships, effects, or differences, rather than on actual data values.
That concludes the article I can share on this occasion. Hopefully, it provides useful insights and adds to the understanding of those currently deepening their knowledge in statistics or econometrics. Thank you, and stay tuned for the next update from Kanda Data.
