Blog
Paired Sample T-test: Definition, Analysis Stage, and Interpreting the Results

Researchers often use the t-test to analyze differences in two sample groups. The t-test that researchers often use consists of the paired sample t-test and the independent sample t-test.
These two tests have the same objective, namely, to find the difference in the mean of the two sample groups. Due to the importance of understanding the difference between the t-test for paired and the t-test for independent samples, Kanda Data will write the topic “When Would We Can Use a Paired Sample t-test?”
I will discuss the t-test for paired samples to provide a deeper understanding. However, before going deeper into the article’s topic on this occasion, we need to know first the difference between the paired sample t test and the independent sample t-test.
Paired Sample t-test
The t-test for paired samples is a hypothesis test conducted to determine whether there is a significant difference between the averages of two paired sample groups. As for the t-test for independent samples, it was not carried out in two paired sample groups.
For the differences between the paired sample t-test and the independent sample t-test in more detail, you can read the previous article entitled: “How to Analyze Paired Sample t-Test and Independent Sample t-Test.“
Therefore, based on what I wrote in the paragraph above, it can be concluded that the t-test for paired samples was carried out only on two sample groups. If the test is carried out with more than 2 sample groups or only one sample group, the paired sample t-test cannot be used.
In addition, paired sample t-tests can be performed to determine statistical differences between two conditions, between two measurements, and between two-time points. An example of a t-test for paired samples namely: (a). A farmer wants to know the difference in milk production before being given and after being given forage; (b) Researchers want to know the difference in company income before and after the pandemic; (c) A doctor wants to know the condition of the difference between the left and right kidneys, and (d) A teacher wants to know the difference between the new learning method and the old learning method.
Some assumptions must be fulfilled when researchers use the t-test for paired samples. The two main assumptions must be fulfilled the data normality test and the homogeneity test. In addition, the main requirement for using this test is that the data is used in pairs and compares only two sample groups.
For data measured using a nominal or ordinal scale, it is better not to use the t-test for paired samples. There are other alternative tests for non-parametric variables. Therefore, using the t-test is recommended to use data measured by interval and ratio scales. To provide a deeper understanding, I will write an example case study that uses a t-test on paired samples.
An example of a case study using the paired sample t-test
On this occasion, I used a case study example in research to measure the effectiveness of using a new learning method for students in a school.
Researchers observed as many as 15 students and experimented with new learning methods. Researchers want to know whether the new learning method is more effective than the old one.
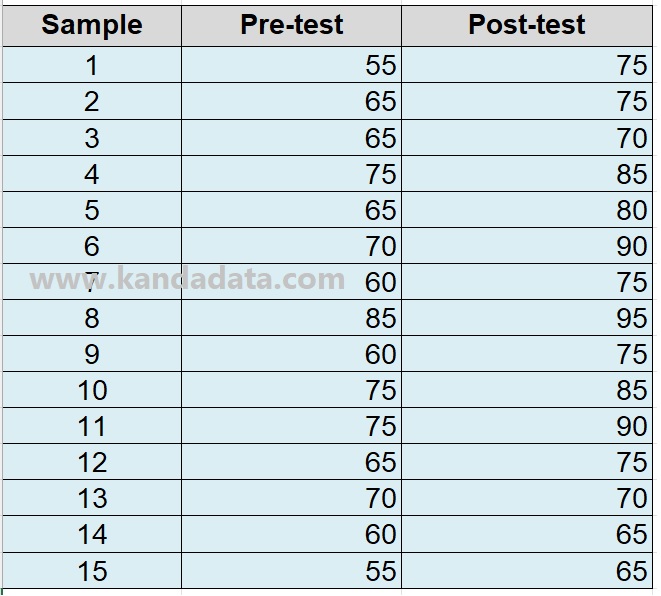
The next researcher tested the students with some questions. The student’s score is called the pre-test. Furthermore, researchers conducted experiments on new learning methods in class on 15 sample students for six months.
At the end of the semester, the researcher retested the same 15 students. The scores obtained by students after the experiment were called the post-test.
Based on the data that has been collected shows that the researcher uses an interval data measurement scale. In more detail, the results of data collection carried out by researchers can be seen in the table below:
Based on the data above, the researcher wants to know whether there is a difference in the mean of the pre-test and post-test sample groups. To test the average difference, the researcher can create a statistical hypothesis consisting of the null hypotheses and alternative hypotheses.
Stages of paired sample t-test in Excel
In order to better understand how to test t for paired samples, I will give an example of the method and stages of analysis. Paired sample t-tests can be computed using any statistical analysis tool you have at hand. Here, I will use Excel for the paired sample t-test.
If you click on the “Data” menu in the upper right corner, there will be a “Data Analysis” menu. If you have not found the menu, you must activate the Excel data analysis toolpak.
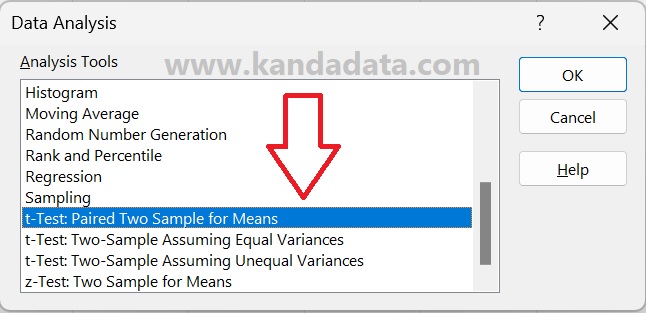
After clicking on data analysis in the upper right corner, several analysis tools provided by Excel will appear. Then select the t-test for paired samples, as can be seen in the image below:
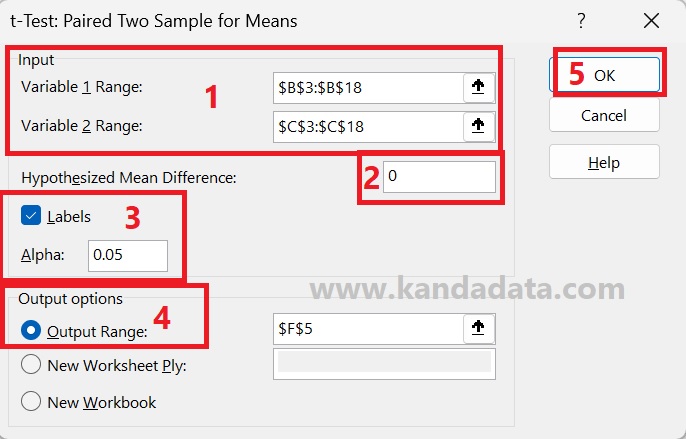
Next, a window entitled t-test: Paired Two Sample for Means will appear. In the next step, you need to input all data in variable 1 and variable 2, including the labels. Next, enable label and Hypothesized Mean Difference input 0.
Here I use Alpha at 5%, and I save it on the same Excel sheet for the analysis output. In detail, the stages of the t-test for paired samples can be seen in the image below:
After you click ok, the analysis results will appear on the same Excel sheet. The results of the paired sample t-test can be seen in the image below:
Interpreting the Results
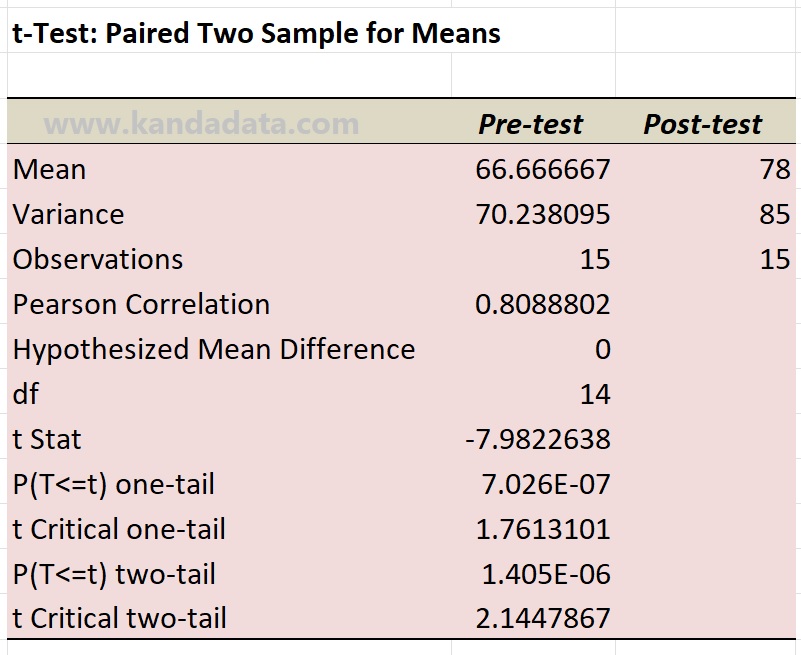
Based on the picture above, it can be seen that the mean post-test value of 78 is higher than the pre-test mean value of 66.67. To test the hypothesis whether there is a significant difference between the pre-test and post-test can be seen in two ways, namely comparing the t-statistical value with the t-critical and looking at the P-value.
We can choose to use either of the two styles to test statistical hypotheses. For example, suppose the hypothesis is created as follows:
H0: The mean pre-test is not significantly different from the mean post-test
H1: The mean pre-test is significantly different from the mean post-test
Based on the two-tail test, the p-value below 0.05 or the t-statistic of 7.98 is greater than the critical value of 2.24. It showed that we rejected H0 or accepted H1. Thus, it can be concluded that the mean pre-test is significantly different from the mean post-test.
Based on the example of the case study and the explanation written in the previous paragraph, we can underline that the t-test for paired samples is carried out on two groups of paired samples. In addition, to use this test, it is necessary to test the assumptions of normality and homogeneity tests.
In this test, it is recommended to use variables measured using interval or ratio scales. It is an article I can write on this occasion, and I hope it will be useful for all of you. There will be updates to educational articles in the following week. Thank you.
Pingback: Wilcoxon Test | Different test of two paired samples for non-parametric variables - KANDA DATA