Tag: statistics
Handling Non-Normally Distributed Data by Removing Outliers
The topic I’m writing about today is prompted by questions on how to handle data that is not normally distributed. We know that in quantitative analysis, several statistical tests require that the data be normally distributed. This is an interesting topic that we will delve deeper into in this article.

Data Measurement Scales for Likert Scale Variables in Non-Parametric Statistics
The use of variables measured with the Likert scale is certainly familiar to us. This scale is often applied in research involving non-parametric variables.

Interpreting Negative Intercept in Regression
When conducting regression analysis, we obtain the intercept and coefficient estimates for each independent variable. These values, both intercept and coefficients, can be positive or negative.
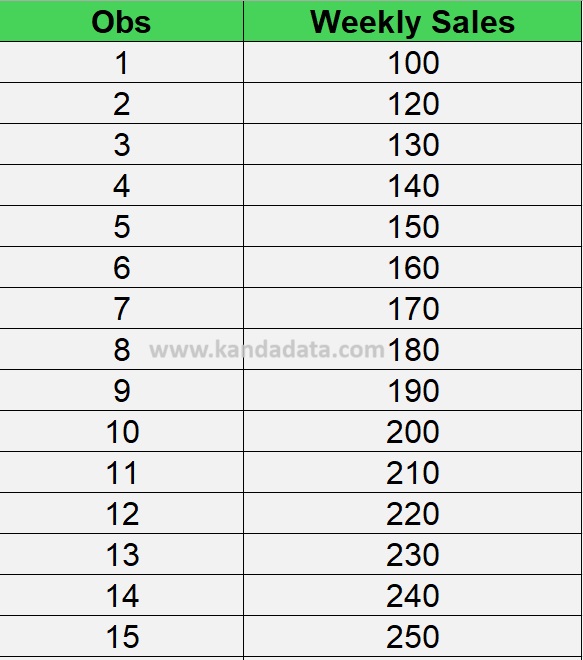
Linear Regression Residual Calculation Formula
In linear regression analysis, testing residuals is a very common practice. One crucial assumption in linear regression using the least squares method is that the residuals must be normally distributed.
Understanding the Difference Between Paired T-Test and Wilcoxon Test in Statistics
In the realm of statistics, associative tests play a crucial role in examining differences, relationships, and influences between variables. One common form of associative test is the test for differences, which aims to compare the means of two or more sample groups.

How to Determine the F-Table Value (F Critical Value) in Excel
In assessing the fit of a linear regression model, researchers need to find the critical values from the F-distribution (F-table). Typically, researchers often use these tables to evaluate the results of regression analysis. However, with technological advancements, determining the F-table value can easily be obtained using Excel.

How to Determine the T-table (T critical value) in Excel for Linear Regression Analysis
In linear regression analysis, to determine the significance of the regression coefficients, researchers need to find the critical values from the t-student distribution (T-table). Typically, researchers often use these tables to evaluate the results of regression analysis. However, with technological advancements, determining the T-table value can easily be obtained using a spreadsheet, such as Excel.

How to Analyze Correlation between Ratio and Ordinal Scale Variables (Different Measurement Scales)
In correlation analysis, we often use Pearson correlation to test the relationship between variables measured on a ratio/interval scale. Variables measured on a ratio/interval scale have a greater potential to meet the normality assumption for data testing.