Author: Kanda Data

How to Test Hypotheses in Regression Analysis, Correlation, and Difference Tests
Hypothesis testing is an important step that researchers must test. Researchers will develop research hypotheses according to the points of research objectives. Furthermore, researchers will test the hypothesis using statistical methods so that the test results can be accounted for scientifically.

How to Calculate Durbin Watson Tests in Excel and Interpret the Results
Researchers who use time series data in linear regression analysis with the OLS method need to conduct some of the required assumption tests. One of the assumption tests required in the regression is the autocorrelation test.
How to use dummy variables as dependent variables in regression analysis
Researchers will generally choose the ordinary least square linear regression method if the variable measurement scale is an interval or ratio scale. If the measurement scale of the data is interval or ratio, it is easy to fulfill the possibility of passing the required assumption test.
How to Analyze Paired Sample t-Test and Independent Sample t-Test
Excel can be used for several data analyzes, including t-tests. Researchers can use the t-test to test the difference in the mean of two variables. The t-test that researchers often use can be divided into two: the paired sample t-test and the independent sample t-test.
Because researchers often use the two t-tests, I will discuss a tutorial on analyzing the t-test and interpreting the results. When researchers choose to use the t-test, assumption requirements must be fulfilled. The first assumption requirement must be fulfilled is that the data used is parametric.
If researchers observe variables measured by interval or ratio data scales, they can use the t-test. However, before using the t-test, researchers need to conduct an additional test, namely the normality test. The normality test ensures that the data group tested for mean differences is normally distributed. Normality test tutorials can read my previous article entitled: “How to Test the Normality Assumption in Linear Regression and Interpreting the Output“
When researchers use the t-test, the researcher must understand whether the data group to be tested for differences is paired or independent data. It is important because the two characteristics of the data will determine the type of t-test analysis chosen. Selection of the correct t-test will avoid bias in making research conclusions. Therefore, researchers are expected to distinguish well when to use the paired sample t-test and when to use the independent sample t-test.
Difference between paired sample t-test and independent sample t-test
After the researcher has ensured that the assumption requirements for using the t-test are met, the researcher needs to understand the differences between the paired sample t-test and the independent sample t-test.
Paired sample t-test is used to test the mean difference of the paired data groups. In comparison, the t-test is used for independent samples to test the difference in the means of independent data groups.
At first glance, these two tests are almost the same, but when used, they will be different. To make it easier to understand the differences between the paired sample t-test and the independent sample t-test, we can use an analogy with two case study examples.
In the first case study, a teacher will apply a new learning method in a school. The new method is very different from the old method, which predominantly uses a one-way learning method.
In contrast, the new method emphasizes two-way learning between teacher and student. Furthermore, a teacher conducted an experiment by applying the new learning model for one semester.
The teacher took a sample of 15 students to be involved in the research activity. Before applying the new method, the 15 students received an initial assignment or a pre-test.
Furthermore, the teacher conducted experiments using new learning methods. After six months, the teacher returned to testing the same 15 students, which we call the post-test. The difference in the pre-test and post-test means of this case; you can use paired sample t-test.
In the second case study example, a manager observes differences in marketing methods to encourage increased product sales. The two marketing methods are named method A and method B.
Furthermore, the manager collects data from 15 stores spread across area A. The manager then collects data on product sales at 15 stores using method A.
On the other hand, the manager also owns 15 stores in different regions. In area B, there are also 15 managed shops. The manager applies marketing method B to area B.
Next, the manager tests the difference in average product sales using marketing method A in area A and marketing method B in area B. You can test the difference between method A and method B using an independent sample t-test.
How to analyze and interpret paired sample-test
Paired sample t-test can be analyzed using the data analysis menu in Excel. Data analysis in Excel will appear if you have activated the data analysis toolpak. This menu is located at the top right of the data menu in Excel.
Following what I have written in the previous paragraph regarding the differences between the paired sample t-test and the independent sample t-test, the teacher has collected 15 sample student scores from the pre-test and post-test. Detailed pre-test and post-test values can be seen in the table below:

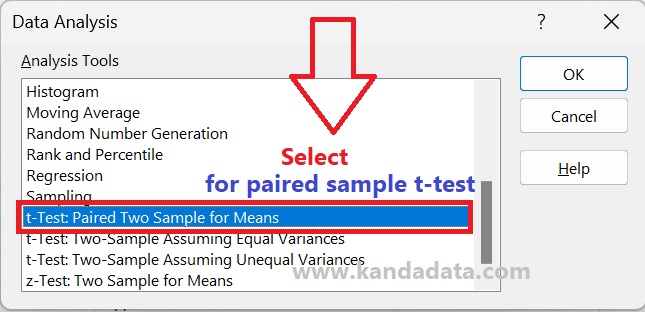
After you click data analysis in the upper right corner, a data analysis window will appear. Excel provides several analysis tool options for data analysis. Because our goal is to analyze paired sample t-tests, select “t-Test: Paired Two Samples for Means” and click ok. In detail, these stages can be seen in the image below:
After you click Ok, the “t-Test: Paired Two Sample for Means” window will appear. You are asked to input all pre-test and post-test data in that window.
For “Variable 1 Range” fill in all pre-test data, including the label. The same thing is done for “Variable 2 Range, ” filled with all post-test data, including the label.
Next, you need to activate the label by giving a checklist. For “Hypothesized Mean Difference” fill in zero. It is intended to test the null hypothesis, whether accepted or rejected.
In this case, the alpha value is set at 5%. Furthermore, the output option is selected on the same sheet. In detail, the stages of analysis of the paired sample t-test can be seen in the picture below:

After you click ok, the output of Excel calculation results will appear. Based on the output that appears, the results of hypothesis testing can be interpreted. It is necessary to compile statistics that are divided into the null hypothesis and the alternative hypothesis.
Null hypothesis (Ho): The mean pre-test and post-test were not significantly different.
Alternative hypothesis (Ha): The mean values of the pre-test and post-test were significantly different.
The output results of the paired sample t-test analysis using Excel can be seen in the figure below:
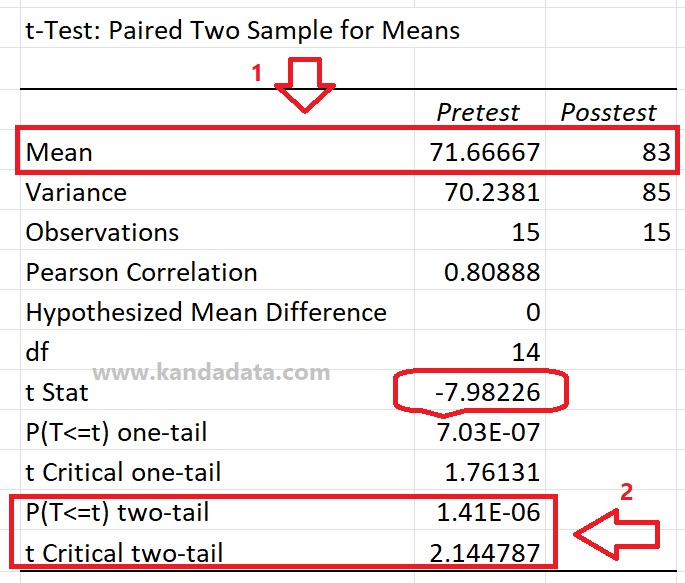
Based on the output of the analysis using Excel, the t-statistic value was -7.98226. Two testing criteria can be used to test whether difference significant pre-test and post-test.
Criteria for statistical hypothesis testing can use the P value and compare the t-statistic with the critical T value. Based on the p-value, the p-value was less than 0.05. In addition, based on the value of the comparison of the t statistic with t critical, it also showed that the t statistic was greater than the t critical.
Based on this value, it can be concluded that the null hypothesis is rejected, or the alternative hypothesis is accepted. Thus, it can be concluded that the average pre-test and post-test values were significantly different. The analysis showed that the average post-test value is higher than the pre-test. Based on the analysis results, the new learning method was more effective than the old one.
How to analyze and interpret independent sample-test
Based on the mini research example that I wrote in the previous paragraph, for independent sample t-test analysis, we used a sample of 15 for two independent sample groups.
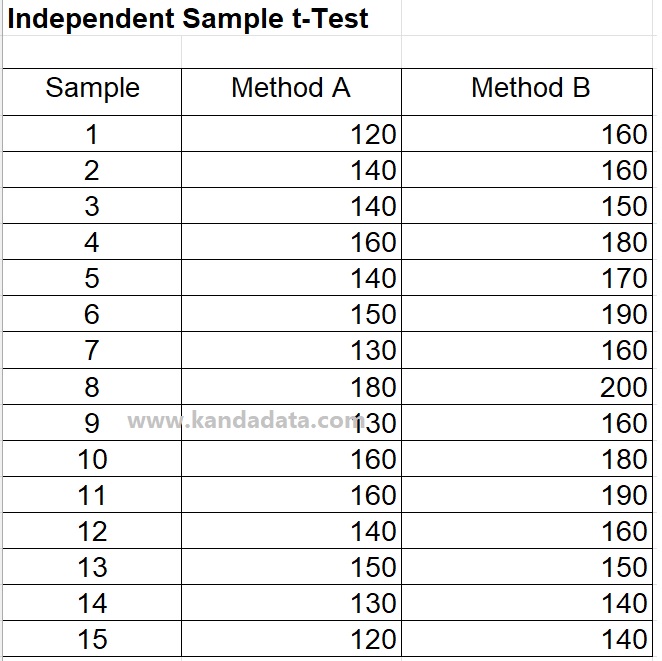
In this case study, the manager wants to compare whether there is a fundamental difference between marketing method A and marketing method B. Based on the results of data collection carried out by the manager, the data obtained can be seen in the table below:
Furthermore, to analyze the independent sample t-test, we use a method that is almost the same as paired sample t-tests. After clicking data analysis and several analysis tools provided by Excel appeared, we selected “t-test: Two-sample assuming equal variance. In detail, these stages can be seen in the image below:

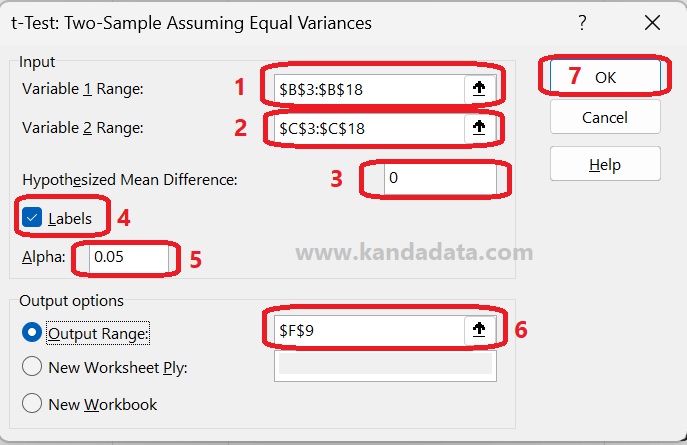
In the next stage, after the “t-Test: Two-sample assuming equal variances” window appears, the next step is that you need to input all variable data used in this mini-research. For input, “Variable 1 Range” is filled with all data, including the label for marketing method A.
Then for the “Variable 2 Range” input, all data, including the label for marketing method B. Don’t forget to activate the label. For “Hypothesized Mean Difference” fill in 0. Why do we fill in the value 0? It is intended to test whether the null hypothesis is accepted or rejected.
Next, the Alpha value is set at 5%, and for the output options, I save them on the same sheet. Then you click ok to bring up the analysis output. The stages of detailed analysis can be seen in the image below:
Then after you click ok, the output from Excel will appear. Furthermore, to test the statistical hypothesis, it is necessary to develop the null hypothesis and alternative hypotheses as follows:
Null hypothesis (Ho): The average value of method A and method B is not significantly different
Alternative hypothesis (Ha): The average value of method A and method B is significantly different.
Two testing criteria can be used to test the statistical hypothesis based on the p-value and compare the t-statistic with the t-critical. The output of the independent sample t-test analysis can be seen in the figure below:
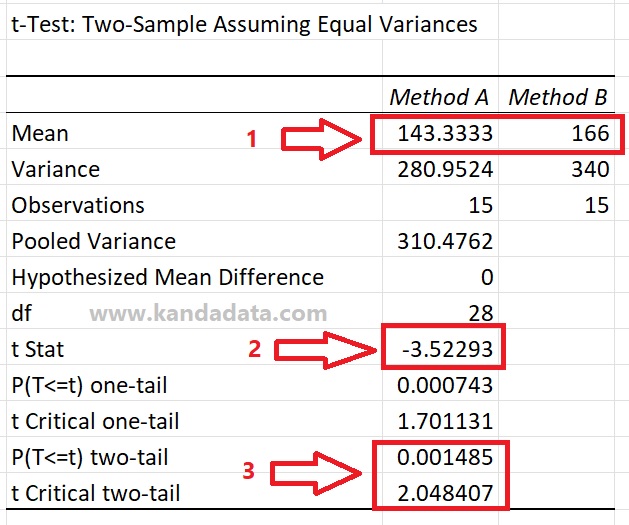
Based on the results of the independent sample t-test analysis above, it can be seen that the t-statistic value was -3.52293. It can be seen that the p-value was smaller than 0.05, and the t-statistic value was greater than the t-critical value to test the hypothesis.
Based on the results of these comparisons, it can be concluded that the null hypothesis is rejected. Because it rejects the null hypothesis, the alternative hypothesis is accepted. Thus it can be concluded that the average value of method A and method B is significantly different.
It can be seen from the average value to see which difference has higher product sales between method A and method B. The results of the analysis showed that the average value of method B was higher than method A, so it is concluded that method B is more effective in selling products than method A.
It is the article I can write on this occasion. Hopefully, the information provided in this article can be helpful for all of you. Wait for an article update from Kanda Data the following week. Thank you.
How to Analyze Multiple Linear Regression in Excel and Interpret the Output
Researchers often use linear regression analysis to analyze associative relationships between variables. Multiple linear regression is an analysis that researchers often use because it can analyze the effect of more than two independent variables on the dependent variable.

How to Determine Samples Size using Proportionate Stratified Random Sampling
A researcher can take samples from the population for observation and research activities. The purpose of taking samples from a population is to save costs and time in research activities.

How to Analyze and Interpret the Durbin-Watson Test for Autocorrelation
Researchers can use regression analysis to determine the effect of independent variables on the dependent variable. The data used in the regression analysis can use cross-section, time series, and panel data. On this occasion, Kanda Data will discuss regression analysis using time series data.
How to Calculate the Regression Coefficient of 4 Independent Variables in Multiple Linear Regression
A multiple linear regression includes at least two independent variables and one dependent variable. In some previous articles, I’ve written about manually calculating multiple linear regression with two and three independent variables.