The t-test is commonly used to test the mean difference between two samples. The t-test can be performed on paired samples as well as independent samples. When should we use the paired sample t-test and when should we use the independent sample t-test?
Before discussing the differences in the usage of these two tests, it is important to understand the assumptions required for the t-test. To use this test, researchers need to ensure that the data is normally distributed. Therefore, researchers need to conduct a test of normality on the data.
One way to test for normality is by using the Shapiro-Wilk test or the Kolmogorov-Smirnov test. If the test results indicate non-normal distribution, it is advisable for researchers not to force the use of the t-test.
How to make the data normally distributed
In accordance with the assumption that data should be normally distributed, researchers should pay attention to the measurement scale of the data. As discussed in a previous article, data measurement scales can be divided into four categories: nominal scale, ordinal scale, interval scale, and ratio scale.
To obtain normally distributed data, it is advisable to test variables measured on an interval or ratio scale. Based on experience, variables measured on a nominal or ordinal scale generally do not follow a normal distribution.
Paired sample t-test
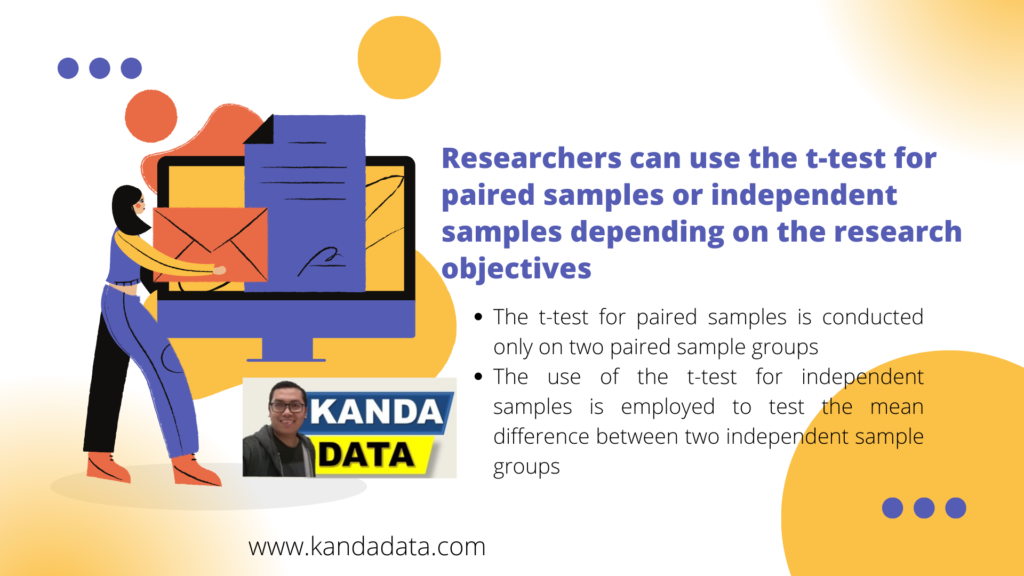
The t-test for paired samples is conducted only on two paired sample groups. In this test, the main assumption is that the samples are derived from two paired groups.
To understand the use of paired samples, let’s consider a researcher who wants to test the difference in mean scores between the use of a new teaching method and an existing teaching method. A sample of 150 students is selected from XYZ school.
Next, the researcher conducts a test to assess the students’ learning ability based on the results of the existing teaching method. This test is called a pretest.
The next step involves the researcher conducting an experiment using the new teaching method for one semester. At the end of the semester, the researcher performs a test again to assess the students’ learning ability. This test is called a posttest.
The objective of this research is to compare the effectiveness of the new teaching method with the old teaching method. Based on this example, the researcher can use the paired sample t-test.
Therefore, in principle, the paired sample t-test is conducted on the same sample. Additionally, the data should also be ensured to follow a normal distribution.
Independent sample t-test
The use of the t-test for independent samples is employed to test the mean difference between two independent sample groups. The required assumption for this test is that the data is normally distributed and is tested on two independent sample groups.
To understand the use of the independent sample t-test, let me provide an example research case. Let’s assume a researcher wants to determine the difference in rice production between Village A and Village B.
The researcher proceeds to collect a sample of 200 farmers from Village A and 225 farmers from Village B. From each selected sample, data on rice production from the latest harvest period is gathered.
Next, the researcher compares the amount of rice production among the 200 sampled farmers from Village A with the production of rice among the 225 farmers from Village B. To test the mean difference in rice production, the researcher can employ the independent sample t-test.
Conclusion
Based on the discussion in the previous paragraphs, when researchers decide to use the t-test, the main requirement is that the data follows a normal distribution. Researchers can use the t-test for paired samples or independent samples depending on the research objectives.
It is important to emphasize that the t-test is performed to test two sample groups. When testing more than two sample groups, researchers cannot use this test anymore.
Alright, this is the article I can write for now. Hopefully, it is beneficial and adds value to our knowledge. Stay tuned for the next article update next week. Thank you.

