Will a high variance value affect the statistical test on linear regression? Many questions related to this topic were Kanda Data obtained. On this occasion, Kanda Data will discuss the impact of the variance value on hypothesis testing on linear regression.
In statistics, the variance value indicates the size of the data distribution. If the variance value is higher, the data is further spread out from the average.
On the other hand, the lower the variance value, the data gets closer to the average value. If the variance is zero, all data has the same value, and there is no data diversity.
I have written about tutorials on calculating simple linear regression and multiple linear regression in several previous articles. Based on the article, test the hypothesis of the effect of the independent variable on the dependent variable partially using the t value.
We can test the hypothesis by comparing the t value with the t table value. Alternatively, we can test the hypothesis by comparing the p-value alpha.
Following the topics we discuss on this occasion, we will try to answer how the impact of high variance values on hypothesis testing in linear regression.
The value of variance has a positive relationship with the standard error. The standard error value is obtained from the square root of the variance. The standard error formula can be seen in the image below:
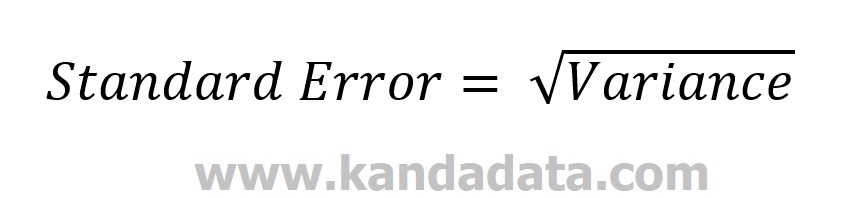
Thus, the higher the variance value, the higher the standard error value. On the other hand, the lower the variance, the lower the standard error.
Next, we will explore how the standard error value relates to the t value in linear regression. The t value is obtained from the estimated regression coefficient value divided by the standard error value. The formula for the t value can be seen in the image below:
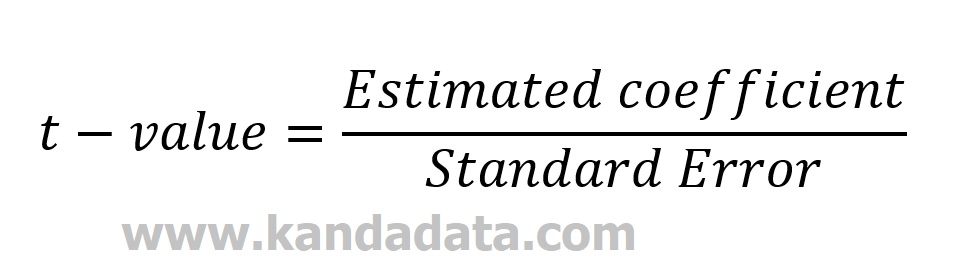
Thus, the t value negatively correlates with the standard error. The higher the standard error causes, the lower the t value. On the other hand, the lower the standard error value, the higher the t value.
Relationship between Variance and Hypothesis Testing on Linear Regression
Based on what has been described previously, we can conclude that the higher the variance value, the higher the standard error value. Furthermore, the higher the standard error value, the lower the t value.
In testing the hypothesis of the effect of the independent variable on the dependent variable in linear regression, we can use the t value. If the t value is getting bigger, then the possibility of rejecting the null hypothesis will be higher.
If we reject the null hypothesis, we accept the alternative hypothesis. If the alternative hypothesis is accepted, the independent variable has a significant partial effect on the dependent variable.
Based on our discussion this time, it can be concluded that a high variance value will impact a smaller t value. The smaller t value in linear regression will potentially lead to a chance that the null hypothesis will be accepted.
Well, that’s what we can discuss on this occasion. Hopefully useful for all of you. See you in the following article!
