
Descriptive statistical analysis is very important in supporting the main data analysis. Researchers can elaborate more deeply on each observed variable through descriptive statistical analysis. In general, analysis statistics can be divided into descriptive statistical analysis and inferential statistical analysis.
The difference between descriptive and inferential statistical analysis is that descriptive statistical analysis only describes each variable based on statistical measures, for example, average, standard deviation and others.
As for inferential statistics, researchers have made estimates using the observed variables. The two statistical analyzes are very important and can be used together. Therefore, on this occasion, Kanda Data will write a tutorial on descriptive statistical analysis using data analysis tools in Excel.
Descriptive Statistical analysis using the Data Analysis Toolpak in Excel
Descriptive statistical analysis can be performed using several data processing applications. Even descriptive statistical analysis can also be done manually by researchers. However, there is an easy way to do descriptive statistical analysis using Excel. As we all know, in data processing, researchers often use Excel to assist in tabulation and simple data analysis.
In Excel, researchers can use data analysis tools to perform various data analyses, for example, regression analysis, correlation, t-test, techniques, etc. To use the data analysis menu in Excel, the researcher must ensure that when clicking on the “Data” menu, there is already a “Data Analysis” menu in the upper right corner.
If the researcher has not found the Data Analysis menu in the upper right corner, then the researcher must activate the Data Analysis toolpak in Excel. For a tutorial on how to activate Data Analysis in Excel, You can read the previous article entitled: “How to Activate and Load the Data Analysis Toolpak in Excel“
Example of Case Study of Descriptive Statistical Analysis
As was written in the previous paragraph, descriptive statistical analysis can be carried out together with the main data analysis. For example, a researcher wants to know how operational costs and advertising frequency affect product sales.
Researchers used multiple linear regression with the Ordinary Least Square method to analyze the data. However, in addition to the main analysis using multiple linear regression, researchers also want to know how the product sales conditions, operational costs, and advertising frequency are in the existing conditions.
Based on the data that has been collected, the researcher collects quarterly data from the 1st quarter of 2017 to the 3rd quarter of 2021, which can be seen in detail in the table below:
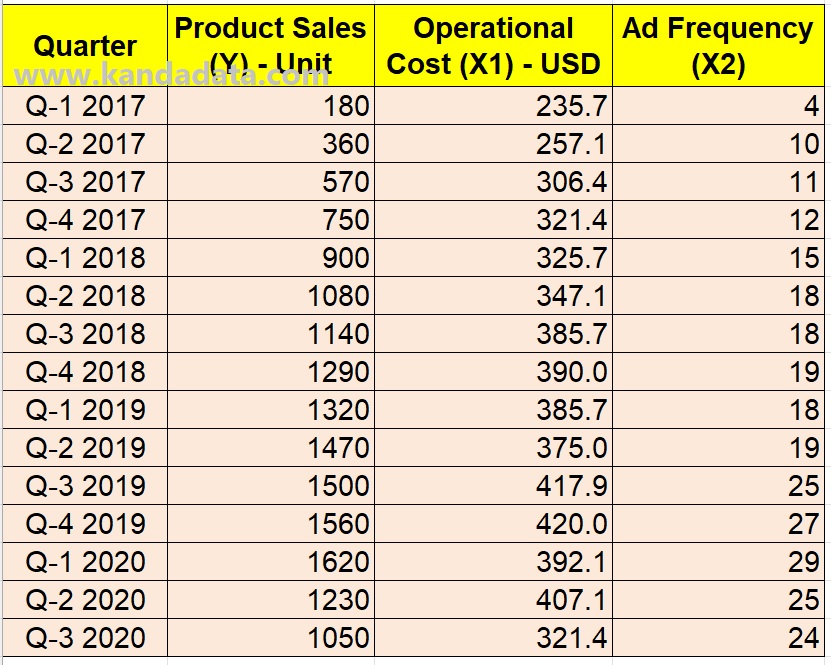
Based on the table above, researchers can perform descriptive statistical analysis on the variable product sales, operational costs, and ad frequency (Ad Frequency). In the case study example, the researcher used Excel data analysis toolpak to conduct a descriptive statistical analysis.
How to analyze descriptive statistics using the data analysis tool in Excel
The steps for carrying out a descriptive statistical analysis using the data analysis tool in Excel are that the researcher needs to open the Excel file in which the data has been input. Next, the researcher clicked on the “Data” menu in the upper right corner. Researchers will find the “Data Analysis” menu, then after clicking it, the “Data Analysis” window will appear as shown in the image below:
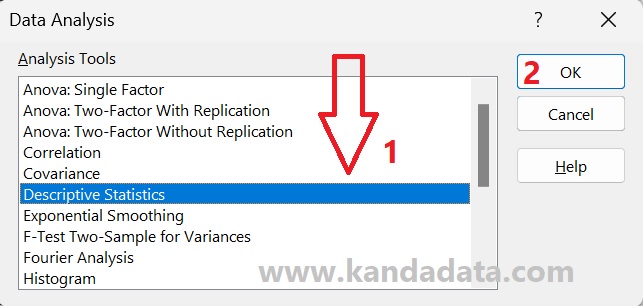
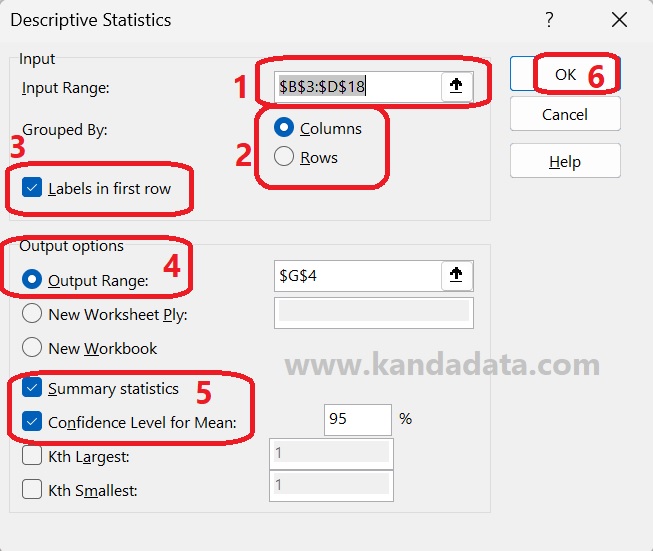
Based on the picture above, researchers need to choose descriptive statistics from the several data analysis options provided by Excel. After clicking ok, a descriptive statistics window will appear. The next step that needs to be done by researchers in descriptive statistical analysis is to input data, including labels (No. 1). Next, the researcher clicks on the column (No. 2) and does not forget to enable the “label in first row” (No. 3).
The output of descriptive statistical analysis can be stored on the same Excel sheet (No. 4). Then enable statistical summary and confidence level for mean (No. 5), and then the researcher clicks ok. The stages that have been conveyed in detail can be seen in the image below:
After clicking ok, the descriptive statistical analysis results will appear on the same Excel sheet. Based on the case study examples, the researcher conducted a descriptive statistical analysis of the three variables: product sales, operational costs, and advertising frequency. The results of descriptive statistical analysis using Excel can be seen in the image below:
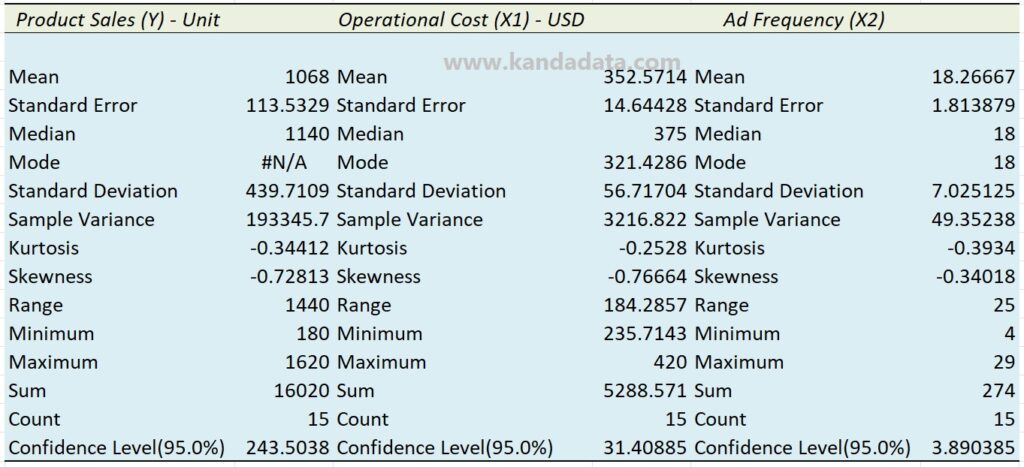
Based on the results of the descriptive statistical analysis, it can be seen that the parameters of the descriptive statistical analysis in Excel include mean, standard error, median, mode, standard deviation, sample variance, kurtosis, skewness, range, minimum, maximum, sum, count, and confidence level.
It is a tutorial on how to analyze descriptive statistics using the data analysis tool in Excel. Hopefully, the article I wrote can be useful for all of you. Wait for the educational article update the following week. Thank you.
