Blog
How to Calculate Coefficient of Determination (R Squared) in Simple Linear Regression

In simple linear regression analysis, the coefficient of determination (R Squared) is one of the outputs that can be used to see the goodness of fit model. Data processing using statistical software, almost all of them, in one of the outputs, show the value of the coefficient of determination. This time, I will write an article on how to calculate the coefficient of determination (r squared) in simple linear regression.
In this article, a tutorial on how to calculate the coefficient of determination by hand will be given. In other words, we do not perform calculations using statistical software in general. We will need tools to calculate by hand to avoid mistakes quickly.
Tools that are often used to calculate manually, you can choose to use a calculator or use excel. I suggest you use excel because it will save more time doing calculations. Before starting to perform calculations, we need to know the concept of the coefficient of determination. What is the coefficient of determination? Then, how to interpret the value of the coefficient of determination obtained from the model built.
Coefficient of Determination Concept (R Squared)
The coefficient of determination (R squared) is often used to test the goodness of fit. Through the coefficient of determination, you can find out how the ability of the independent variable in explaining the dependent variable is. The value of the coefficient of determination in the statistical software output will generally be in the model summary table.
The value of the coefficient of determination is between 0 and 1. The closer to 1 the value of the coefficient of determination is, the better your model will be. On the other hand, the closer to 0 the coefficient of determination, the worse your model will be.
In compiling a model, you want a model that you specify to have good results. If the value of the coefficient of determination is close to one, it means that the specification of the model you have built is good. What is the minimum coefficient of determination so that a regression model is said to be good? Based on several studies and previous studies, the value of the coefficient of determination in research using time series data will be higher than research using cross-sectional data. The value of the coefficient of determination in the time series data of 0.80 can be said to be good. Then the coefficient of determination in the cross-section data with a value of 0.60 and above is good enough.
Coefficient of Determination Calculation Formula
Calculating the coefficient of determination in simple linear regression will be more straightforward. The calculation formula is also quite simple. In calculating the value of the coefficient of determination, you must first calculate the estimated value of b1. You can follow the tutorial on how to calculate it: “How to Calculate bo and b1 Coefficient in Simple Linear Regression Using Original Sample Observation.”
In another calculation component, you need to find the value of the difference between the observed value X and the average value (x) and the difference between the observed values Y and the average value (y). The formula for calculating the coefficient of determination referring to the book written by Koutsoyiannis (1977) can be seen in the equation below:

Based on the above equation, you need to perform a mathematical operation to get the sum (sigma) of xy and the sum (sigma) of y squared.
Exercise Calculation of the Coefficient of Determination
The next step to understand more about calculating the coefficient of determination is to perform an exercise. You can exercise using the data you have. Suppose you don’t have data to process. In that case, you can use the research example that I discussed in the article “How to Calculate bo and b1 Coefficient in Simple Linear Regression Using Original Sample Observation”.
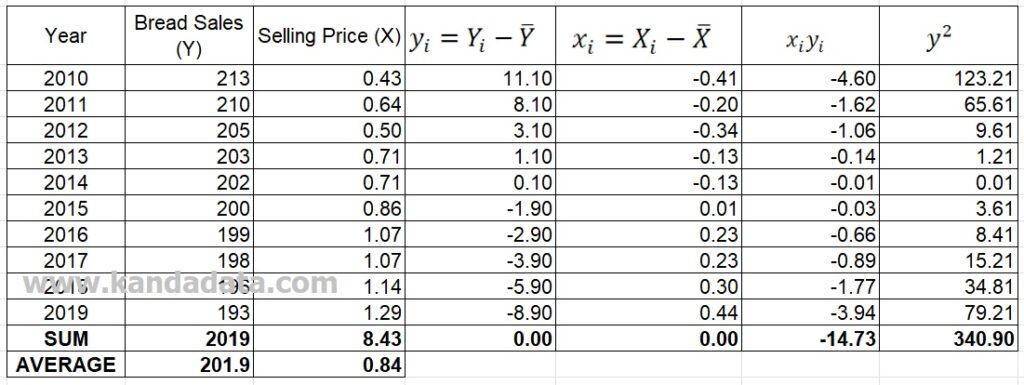
If you have input data into excel, you need to create four columns. Fill in the column sequentially with y, x, xy, and y2. In the last row of your Excel data, you need to add two rows to calculate the sum and the average value. Please calculate the Sum and Average values of each related variable. To make it easier for you to understand what I mean, you can see the image below:

In the first additional column in excel, you need to calculate the y value by subtracting the initial observation value of the Y variable (Y) with its average value (Y bar). In the same way, you can calculate the value of x = X-Xbar. In the next column, for calculating xy and y2, you can perform general mathematical operations.
If you perform calculations using the data I provided, the results of the analyses will be obtained as values as shown in the image below:
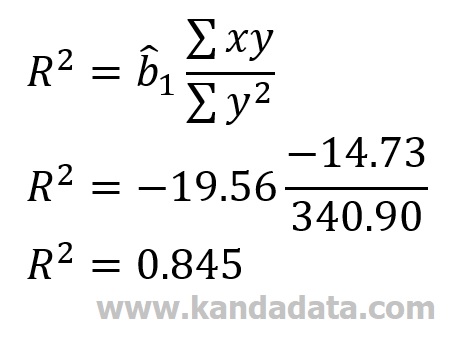
Now, you have got all the components needed to calculate the value of the coefficient of determination. The details include the estimated coefficient of b1, the sum of xy, and the sum of y2. The calculation results that I get are as follows:
Coefficient of Determination Value Interpretation
Based on the calculation results, the coefficient of determination value is 0.845. If you look at the coefficient of determination of 0.845, it means that the value is close to 1, thus indicating that the model has good goodness of fit. The interpretation of R squared by 0.845 means that the variation of the independent variable of 84.5% can explain the variation of the dependent variable.
We can also conclude that the variation in bread sales of 84.5% can be explained by variations in selling price. The remaining 15.5% is explained by other variables not included in the model.
Closing
Based on the conveyed from the beginning to the end of this article, we can calculate the value of the coefficient of determination correctly. In addition, besides understanding the concept of the coefficient of determination and interpreting the results, we need to know how to calculate manually.
That’s the article that I can convey this time. I hope it will be beneficial for all of us. See you in the following article!
1 comment
Leave a Reply
You must be logged in to post a comment.
Thank you mas Bro… I hope be beneficial for all of us