Blog
How to Use Dummy Variables in Linear Regression with Ordinary Least Square Method
Many researchers have chosen linear regression using the ordinary least square (OLS) method because it can obtain the best linear unbiased estimator. To get the best linear unbiased estimator, researchers need to test the assumptions required for linear regression using the OLS method.
The estimation results from linear regression can be used to determine a one-way causal relationship. In general, linear regression with the OLS method can reveal the effect of one variable on other variables.
In linear regression analysis using the OLS method, the affected variable is the dependent variable, while the influencing variable is the independent variable. The dependent variable is one variable, while the independent variable can be one or more than one variables.
The linear regression equation of one dependent variable and one independent variable is called simple linear regression. A linear regression equation consisting of one dependent variable and two or more independent variables is called multiple linear regression.
Both simple and multiple linear regression must be tested for assumptions to obtain the best linear unbiased estimator. Thus, what factors do researchers need to pay attention to so that the data collected can get the best linear unbiased estimator?
In linear regression with the OLS method, if the variable data is measured by a ratio scale or interval scale (parametric), it will generally pass the regression assumption test. If some do not meet the assumptions, it is usually caused by the characteristics of the data. For example, there are outliers; the sample data is too heterogeneous; etc.
Therefore, if the researcher measures the variable with a ratio scale/interval scale and wants to know the effect of the independent variable on the dependent variable, it is advisable to use linear regression with the OLS method. However, there are often questions. Is it possible to use the OLS method to use non-parametric variables in linear regression?
I answered, yes! Linear Regression with the OLS method can add independent variables with nominal scale measurements. Variables that are measured on a nominal scale are called dummy variables. The difference between the interval/ratio scale and the nominal scale can be seen in my previous article entitled: “Nominal, Ordinal, Interval, And Ratio Scales | Types Of Data Measurement“
What is a dummy variable?
The dummy variable in linear regression using the OLS method is a non-parametric variable that can be included in the regression equation. Dummy variables can be created in a binary dummy variable or a non-binary dummy variable.
On this occasion, using the OLS method, Kanda Data will write about using binary dummy variables in linear regression equations. As the name implies, a binary dummy variable is a dummy variable consisting of two categories.
For example, the researcher wants to know the influence of advertising costs and marketing personnel on car sales. In addition, researchers also want to know whether there is a difference between car unit sales in the capital city area and car sales in the suburban area.
Regional differences, namely capital cities and suburbs, can create dummy variables. Furthermore, so that the dummy variable can be analyzed quantitatively, it is necessary to give a score. In the binary dummy variable, scores are given 1 and 0.
The next question is, how do researchers determine a score of 1 and a score of 0? The method of giving a score to the dummy variable is based on the researcher’s assumptions about the observed variables. For example, is the capital city given a score of 1 or 0?
In the example above, for example, the researcher suspects that car sales in the capital city are relatively higher than car sales in suburban areas. The reason is that the capital city is the center of economic activity in the area studied, so it is suspected that car sales will be higher. Therefore, the dummy variable scoring technique is:
Capital City = Score 1
Suburban area = Score 0
Examples of using dummy variables in regression equations
To provide a deeper understanding, Kanda Data will provide an example of using dummy variables in a mini-research example. A researcher has conducted a mini-research on 30 Car Sales Stores in the capital city and suburban areas.
The researcher aims to determine the influence of advertising costs, marketing personnel, and car sales store location on car sales. The car store location is created as a dummy variable. The specifications of the linear regression equation with the OLS method are:
Y = b0+b1X1+b2X2+b3D+e
Description:
Y = Car sales (units)
X1 = Advertising costs (USD)
X2 = Marketing personnel (people)
D = Dummy variable/Car Sales Store Location (1=capital city & 0=suburban area)
b0,b1,b2,b3 = Coefficient of regression estimation
e = Disturbance error
Because the data collected is from 30 car sales stores, it is called cross-section data. The data that has been collected can be seen in the table below:


How to analyze regression with dummy variables in SPSS
Linear regression analysis using dummy variables can be conducted by manual calculations or statistical software. On this occasion, for linear regression analysis using the OLS method, Kanda Data will use SPSS.
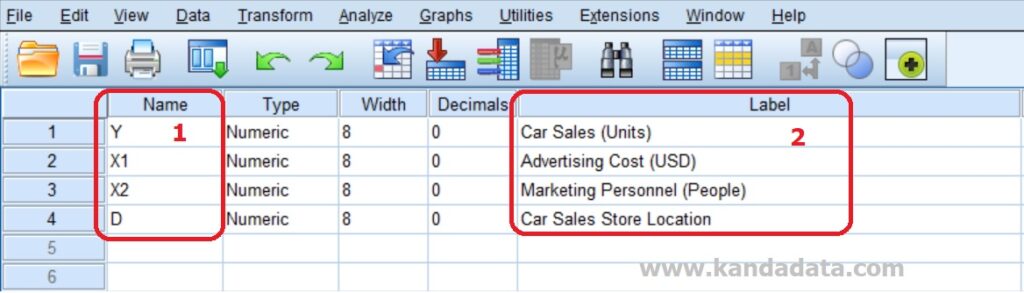
The first step is setting “Variable View” in SPSS. In “Variable View” in SPSS, we need to input four variables, including variables Y, X1, X2, and D. For more details, setting “Variable View” in SPSS can be seen in the image below:
In the second step, after setting “Variable View” in SPSS, you can input data on the “Data View” page in SPSS. Data can be inputted one by one directly in SPSS “Data View” or copy-paste from data that has been inputted in other applications.
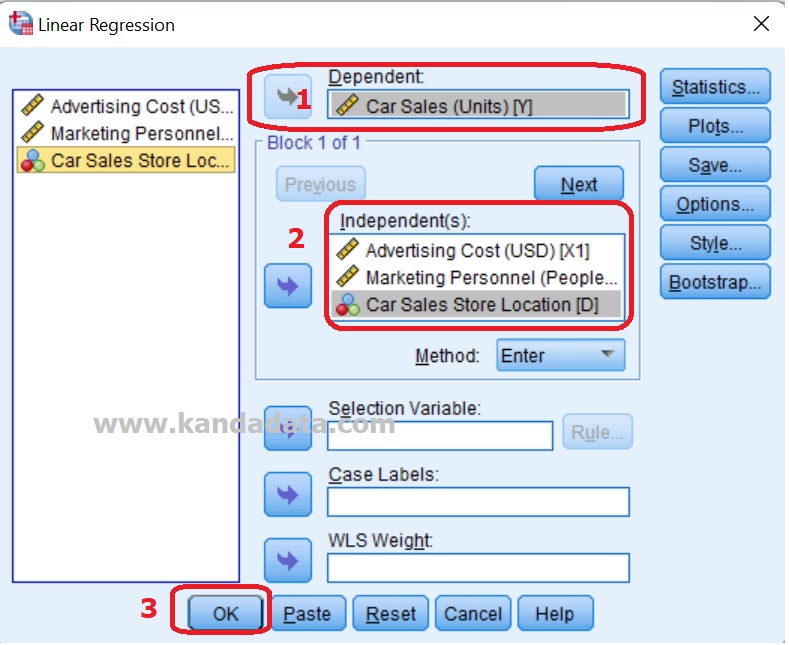
In the third step, you click Analyze -> Regression -> Linear. Next, the “Linear Regression” window will appear. Move Car Sales (Y) to the Dependent box and move advertising costs (X1), marketing personnel (X2), and car sales store location (D) to the Independent box. More detail can be seen in the image below:
After you click OK, the linear regression analysis output from SPSS will appear.
How to interpret the dummy variable’s estimation coefficient
The interpretation of the estimated coefficient of the dummy variable is slightly different from the interpretation of the other estimation coefficients. SPSS output which displays the estimated coefficient of the dummy variable, can be seen in the image below:
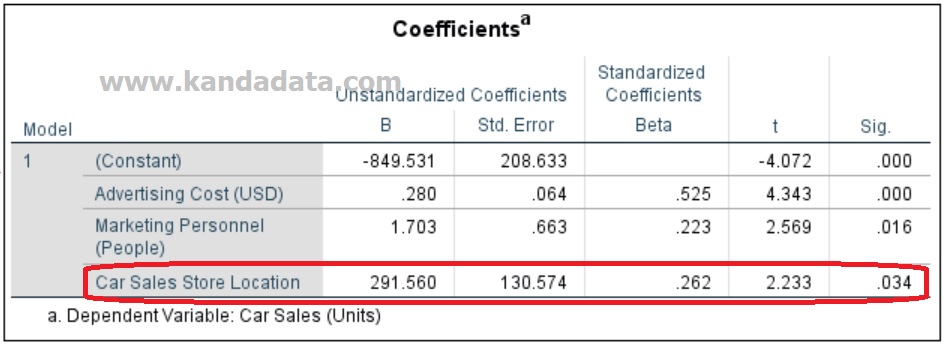
Based on the SPSS output above, it is known that the estimated coefficient of the dummy variable is 291.560 with a P value <0.05. Based on the estimated coefficient value of the car store location (dummy variable), the average car sales in the capital city is 191,560 times higher than the car sales in suburban areas.
Closing remarks
Based on what I wrote in the previous paragraph, linear regression with the OLS method can use variables with nominal (non-parametric) scales. Variables measured by a nominal scale or called dummy variables can be included as independent variables in the regression equation. That’s what I can write for all of you. Wait for the next article update!