
The selection of data analysis methods is important in determining the study’s results. Data analysis methods not following statistical theory and scientific principles can potentially cause errors in making research conclusions. The research hypotheses prepared at the beginning of the proposal need to be tested statistically so that the correct findings can be obtained. Therefore, a basic understanding of statistics needs to be understood by those conducting research activities.
Regression analysis is very popular for researchers, both for writing a bachelor thesis, master thesis, and dissertation thesis, decision-making at the company level, and scientific development. Although the regression consists of linear and non-linear regression, linear regression is the most widely chosen data analysis method by researchers. Regression was selected because it can answer the estimated influence of one variable on other variables at one time and several times (time series).
Most of the regression equation specifications compiled are single equations with assumptions that must be fulfilled. In various research results that have been published, linear regression using the ordinary least square method is the most dominant one used by researchers. It is important to test this assumption to obtain the best linear unbiased estimator.
Mini research for Data Time Series
Multiple linear regression analysis is intended to test the effect of independent variables on the dependent variable, where the number of independent variables is 2. For example, a manager observes how advertising costs and marketing staff can influence product sales in a company XYZ. Data were collected quarterly from the 4th quarter of 2016 to the 2nd quarter of 2020.
Variable specifications are carried out on the dependent and independent variables to be analyzed. The manager determines product sales as the dependent variable/response (Y), advertising costs, and marketing staff as independent variables/ predictors, respectively, as X1 and X2. Data has been collected every three months (quarterly) based on the company’s 15 observations (n) secondary data.
The data collected is time series data with particular objects and consists of several periods. Then the data is inputted into Microsoft Excel, as detailed in the table below:

The data that has been inputted in Microsoft Excel can then be directly processed using the Data Analysis menu. In the previous article, I have written how to activate the Data Analysis menu in Microsoft Excel.
Data Analysis Procedure
Firstly, the steps for processing multiple linear regression analysis data are to open the Microsoft Excel file that has been inputted with the variables to be tested. Then click the Data menu. From the various options in the upper right corner, click the Data Analysis menu. After clicking on Data Analysis, a Data Analysis window will appear containing various analysis tools provided by Microsoft Excel, as shown in the image below:

In the next step, please select regression from the available analysis tools. After the regression is clicked, a new Regression window will appear. At this stage, to be able to process multiple linear regression analysis data, it is necessary to input the Y variable and the X variable. The first stage is to input all product sales variable data (Y) into the Input Y Range, then click the up arrow to open as in the following picture:

Then input all product sales data with the label in the Microsoft Excel system. In the same way, please input the variable cost of advertising (X1) and marketing staff (X2).
After all dependent and independent variables have been entered in excel, please activate Labels and activate the 95% confidence level. Labels are activated because when inputting data in excel, in addition to inputting data, labels from these variables are also inputted.
The next step is determining the option where the output will be displayed. In the default version of excel, there are three options: Output Range, New Worksheet Ply, and New Workbook.
These output options explain that if the Output Range is enabled, it means that the analysis results will be displayed on the desired sheet. Furthermore, for New Workbook, the output of the analysis results will be shown in a new workbook file. Then for New Worksheet Ply, the output will be displayed on different sheets in one excel file.
In this case, the output will be displayed on the same sheet to the right of the data that has been inputted in Microsoft Excel, so Output Range is enabled. The stages that have been conveyed will be clearer, as shown in the following figure:

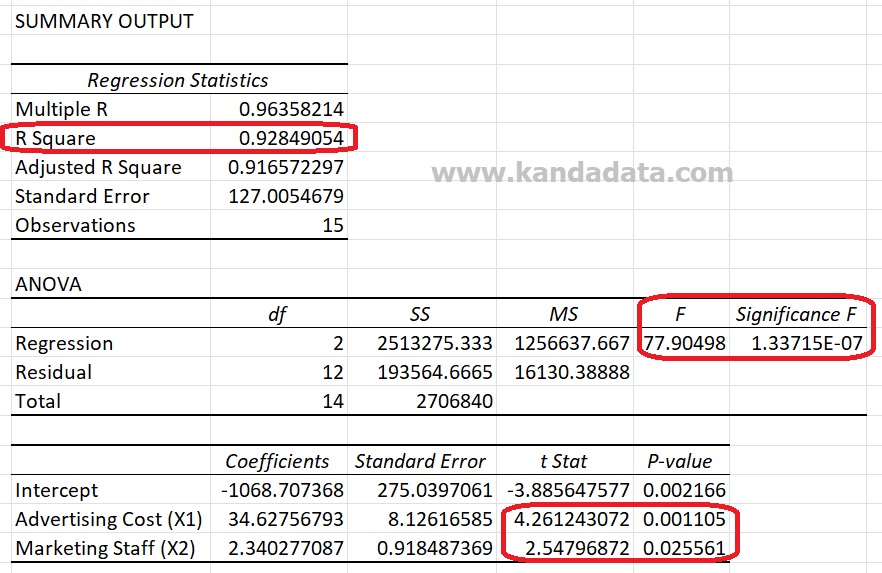
In the last step, please click OK so that the analysis results appear on the same sheet. The multiple linear regression analysis outputs can be adjusted to the row width to look neater. The results of multiple linear regression analysis of the effect of advertising costs and marketing staff on product sales using excel in detail can be seen in the figure below:
Output Interpretation
Based on the output of multiple linear regression analysis for time series data, the first thing that needs to be interpreted is the R Square value. The analysis results showed that the value of R square is 0.9284, meaning that the regression equation can be called a good model. The R square value of 0.9284 means that the variance of independent variables can explain the dependent variable variance of 92.84%; the remaining 7.16% is explained by other variables not defined in the model.
Secondly, we know the F value of 77.90 with a p-value <0.05, meaning that simultaneously the independent variable has a significant effect on the dependent variable. Thirdly, to determine the partial effect of each independent variable, it can be seen from the t value. The analysis showed that the advertising cost variable partially has a significant effect on product sales (p-value <0.05). Marketing staff also partially affects product sales (p-value <0.05).
Fourthly, we need to ensure that if all the assumption tests have been met, then look at the estimated coefficient of advertising costs and the number of marketing staff, both of which have a positive sign. A positive coefficient value means that an increase in advertising costs and marketing staff is estimated to increase product sales. That’s all I can write on this occasion. Hopefully useful for all of you! For an in-depth understanding of multiple linear regression analysis, I highly recommend the book Regression Modeling Strategies: With Applications to Linear Models, Logistic and Ordinal Regression, and Survival Analysis.
