
In social research, many researchers measure variables using the Likert scale. Have you ever conducted research involving variables measured with the Likert scale? In this article, Kanda Data will discuss variables measured using the Likert scale and provide a tutorial on how to tabulate Likert scale variables.
In social research, many variables are analyzed using non-parametric statistics. Variables analyzed with non-parametric statistics are generally measured on nominal or ordinal scales. Variables measured using the Likert scale are essentially the same as ordinal scale measurements, where variables are categorized and ranked.
For example, consider the variable Educational Level. Educational Level is categorized based on the highest level of education completed by respondents, such as elementary school, junior high school, senior high school, and university. In this category, it is clear that respondents who graduated from university are considered to have a higher level of education than those who only completed junior high school.
These categories are then assigned scores in ascending order, where respondents with a higher educational level are given higher scores. In line with this principle, variables measured using the Likert scale follow the same concept as ordinal scales.
Variables commonly measured using the Likert scale include consumer satisfaction, employee performance, employee motivation, attitudes, and similar variables. These variables do not inherently produce numerical values, so a Likert scale is used to quantify them.
Likert scales can vary, commonly ranging from 1-3, 1-5, or even 1-9. However, the 1-5 scale is the most widely used by researchers. In the case study presented in this article, we will use the 1-5 scale.
Case Study Example
For this tabulation exercise of Likert scale variables, we will use the variable of farmers’ perceptions. In this case study, the objective is to analyze farmers’ perceptions of the effectiveness of an organic rice cultivation extension program in the ABC region.
Data was collected from 20 respondents, all of whom are farmers participating in the organic rice program. Each respondent was asked to respond to five statements using a Likert scale with the following options: Strongly Disagree, Disagree, Neutral, Agree, and Strongly Agree.
The five statements are as follows:
- The clarity of the extension materials delivered during the program.
- The extension workers’ ability to deliver the organic rice cultivation materials.
- The suitability of available infrastructure to the needs of organic rice farmers.
- The timing and frequency of the extension program implementation.
- The impact of the extension on organic rice cultivation outcomes.
The scoring for each response is as follows:
- Strongly Disagree = 1
- Disagree = 2
- Neutral = 3
- Agree = 4
- Strongly Agree = 5
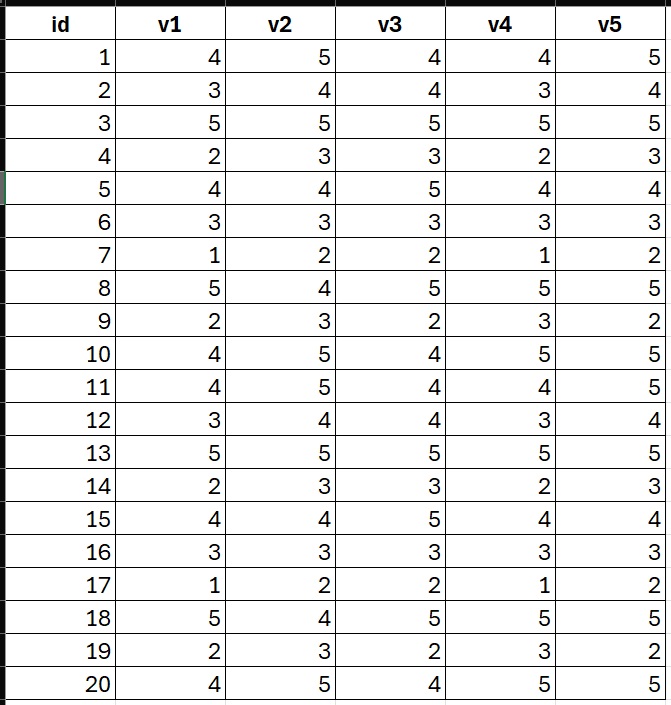
In this questionnaire, all statements are favorable statements, so there is no need for reverse scoring in this case study. Once the data is input as scores, it will appear as shown in the table below:
In this questionnaire, all statements are favorable statements, so there is no need for reverse scoring in this case study. Once the data is input as scores, it will appear as shown in the table below:
Tutorial on Tabulating Likert Scale Data Using STATA
In this article, Kanda Data will provide a tutorial on how to tabulate Likert scale data using STATA. This tutorial will cover how to calculate total scores, average scores, and categorize farmers’ perceptions into ‘bad,’ ‘moderate,’ and ‘good’ categories based on their scores.
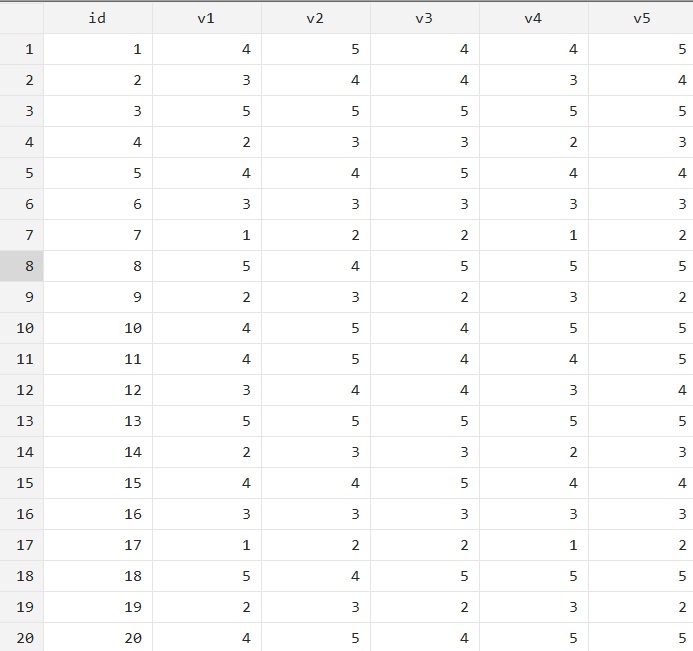
First, import your dataset from an Excel file. Go to File → Import → Excel Spreadsheet. Once the preview window appears, check the option “Import first row as variable names,” then click OK. To review the imported data, click the Data Editor tab in STATA. The data will appear as shown below:
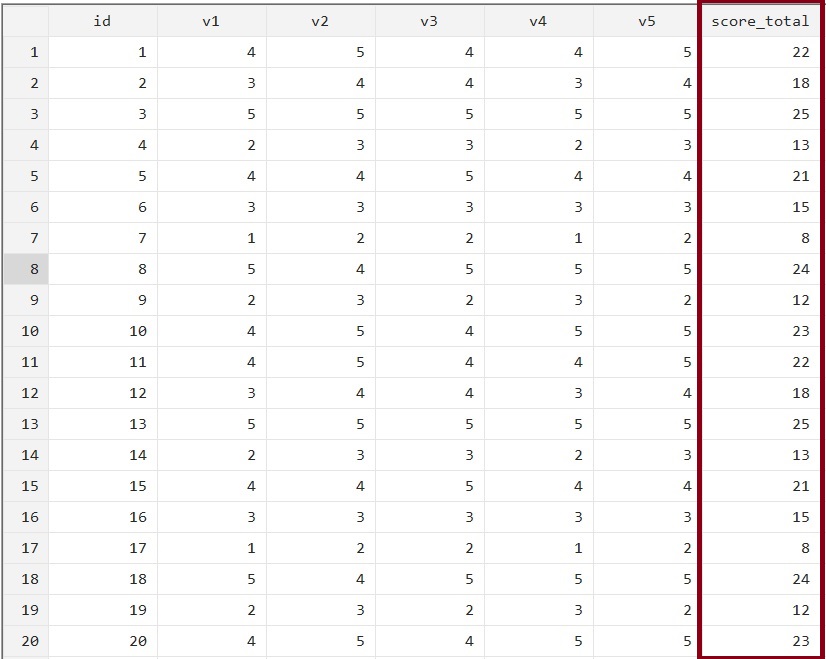
To create a column containing the total score per respondent in STATA, type the following command:
gen score_total=v1+v2+v3+v4+v5
Press Enter, and a new column score_total will appear in the Data Editor, as shown below:
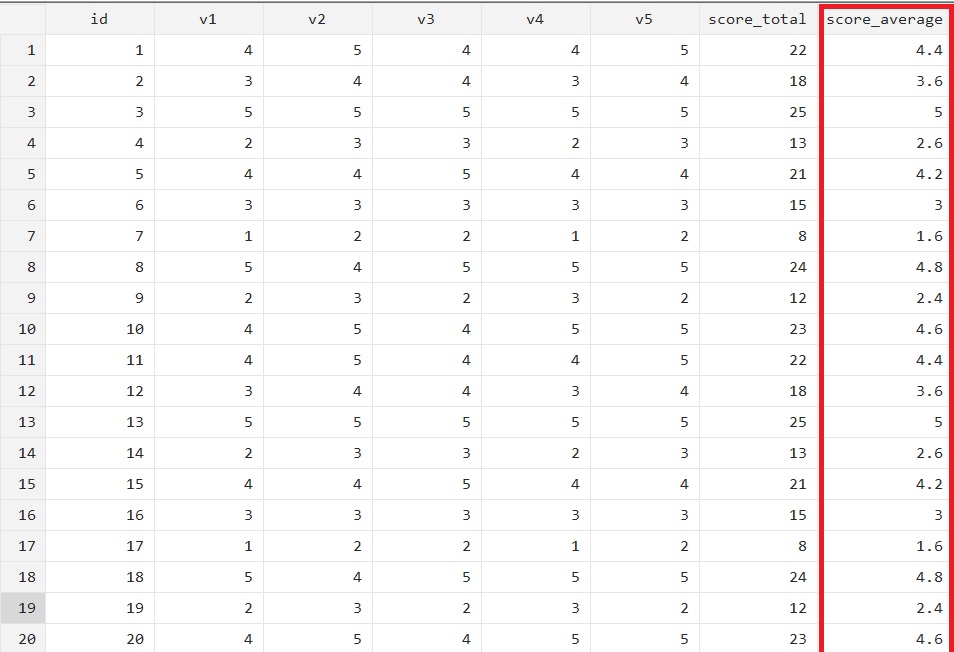
To create a column for the average score per respondent in STATA, type the following command:
gen score_average=score_total/5
After pressing Enter, a new column will appear, as illustrated below:
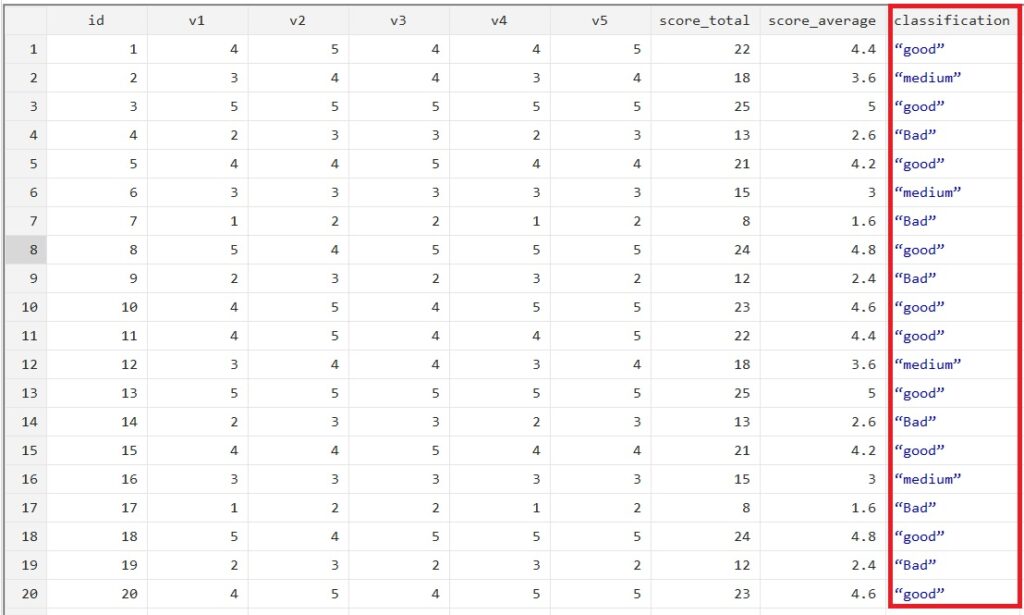
Next, we will classify the scores into the following perception categories: Bad: Total score ≤ 14; Moderate: Total score > 14 and ≤ 19; and Good: Total score > 19. Use the following commands to create the classification:
gen classification=.
replace classification=1 if score_total <=14
replace classification=2 if score_total >14 & score_total <=19
replace classification=3 if score_total >19
label define classification_label 1 “Bad” 2 “medium” 3 “good”
label values classification classification_label
After pressing Enter, a new column will appear showing the farmers’ perception classifications, as shown below:
Conclusion
That concludes the tutorial on how to tabulate Likert scale data using STATA provided by Kanda Data. Hopefully, this tutorial has been useful and insightful for those who need it. Stay tuned for more articles from Kanda Data in the future.
