Author: Kanda Data
How to Perform Multiple Linear Regression in Excel | Data Analysis Toolpak Tutorial
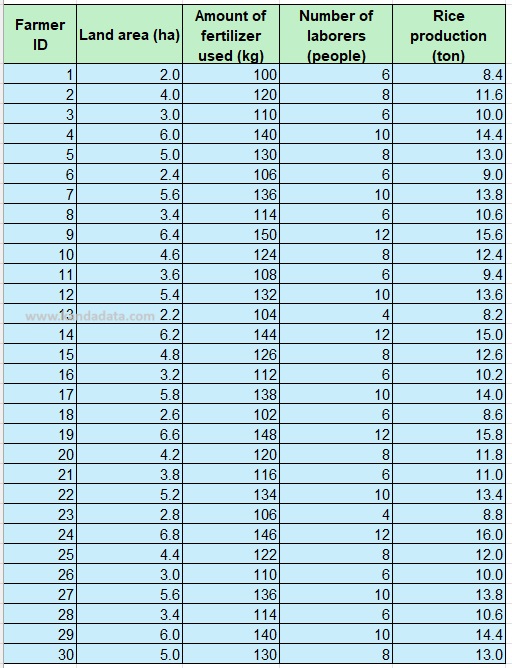
Multiple linear regression is a statistical method used to analyze two or more independent variables in relation to a dependent variable. In this article, Kanda Data will discuss how to perform multiple linear regression analysis using Excel through the Analysis Toolpak menu.

Data Transformation to Address Non-Normally Distributed Data
The assumption that data must be normally distributed is often a prerequisite for using certain inferential statistical tests. However, sometimes the test results do not meet expectations, indicating that the data is not normally distributed.
Handling Non-Normally Distributed Data by Removing Outliers
The topic I’m writing about today is prompted by questions on how to handle data that is not normally distributed. We know that in quantitative analysis, several statistical tests require that the data be normally distributed. This is an interesting topic that we will delve deeper into in this article.

Data Measurement Scales for Likert Scale Variables in Non-Parametric Statistics
The use of variables measured with the Likert scale is certainly familiar to us. This scale is often applied in research involving non-parametric variables.

The Differences Between Nominal Data Scale and Ordinal Data Scale in Research Variable Measurement
In statistical analysis, data measurement scales are divided into four main categories namely nominal scale, ordinal scale, interval scale, and ratio scale. A proper understanding of the differences among these scales is crucial for determining the appropriate data analysis method.

Dummy Variables in Multiple Linear Regression Analysis with the OLS Method
Multiple linear regression analysis is a well-known technique frequently used by researchers to analyze the influence of independent variables on dependent variables. The ordinary least squares (OLS) method is one of the most commonly used methods in this analysis.

Interpreting Negative Intercept in Regression
When conducting regression analysis, we obtain the intercept and coefficient estimates for each independent variable. These values, both intercept and coefficients, can be positive or negative.
Linear Regression Residual Calculation Formula
In linear regression analysis, testing residuals is a very common practice. One crucial assumption in linear regression using the least squares method is that the residuals must be normally distributed.