Blog
Correlation Analysis for Variables Measured with a Likert Scale (Ordinal Scale)
Many researchers choose to use correlation analysis to know the relationship between variables. The simpler analysis technique causes correlation analysis to be widely used by researchers.
However, not all variables use the same method and stages in correlation analysis. The choice of correlation analysis technique depends on the data measurement scale used. As I wrote in the previous article, the data measurement scale is divided into nominal, ordinal, interval, and ratio scales.
The choice of correlation analysis also differs depending on the scale of measurement of the data. For variables that are measured using an interval/ratio scale, you can use Pearson correlation analysis. Variables measured using an ordinal scale can be analyzed using Spearman rank correlation. Furthermore, chi-square can be used for variables measured using a nominal scale.
On this occasion, Kanda Data will discuss correlation analysis using an ordinal scale in more detail. One of the measurements with an ordinal scale, including the measurement of variables using a Likert scale.
Variable Measurement Using Likert Scale
In principle, variables measured by a Likert scale are the same as data measured by an ordinal scale. Generally, the variables measured using a Likert scale are included in non-parametric variables.
Numerical values cannot be directly obtained from variables measured using a Likert scale. Therefore we need a method so that non-parametric variables can be analyzed. Examples of non-parametric variables are behavior, motivation, competence, attitude, performance, etc.
We will not immediately get a numerical value if we measure the competency variable. It is different if we measure the profit variable (ratio scale), where we can immediately get a numerical value so that it can be continued with data analysis using computer software.
To measure competency variables, we can make statement items representing the measured variables. The number of statement items is not limited until it is considered to represent the competence variable.
Furthermore, the selected respondents will be asked to respond to the statement items with multiple answers. The answer choices for statement items that use a Likert scale can use a scale of 1-5, with details of answer choices and scores as below:
Strongly Agree (Score 5)
Agree (Score 4)
Neither Agree nor Disagree (Score 3)
Disagree (Score 2)
Strongly Disagree (Score 1)
If the competency variable is created in 9 statement items, and the respondent answers all statement items, it will be obtained:
Minimum Score = Lowest Score x Statement Item
Minimum Score = 1 x 9
Minimum Score = 9
Maximum Score = Highest Score x Statement Item
Maximum Score = 5 x 9
Maximum Score = 45
Based on the above calculations, we can conclude that the competency variable has the lowest score of 9 and the highest score of 45. The total score of each statement item represents the competency variable.
Validity and Reliability Test
After we have created statement items using a Likert scale, the next step is to test the validity and reliability. Validity and reliability tests aim to ensure that the questionnaires/instruments created are valid and reliable.
To test the validity and reliability, researchers can choose respondents outside the primary sample. The data obtained is continued with an evaluation based on the validity and reliability of test outputs.
If the statement items from the variables are valid and reliable, it can be continued by collecting data from the primary sample. If the statement items are invalid, the researcher needs to make improvements to the statement items until all items become valid and reliable.
Example of Research with Variables measured by Likert Scale
To provide a deeper understanding, I will give an example of correlation analysis research on variables measured using a Likert scale. The research was conducted to know the relationship between farmer competence and the business performance of broiler chickens.
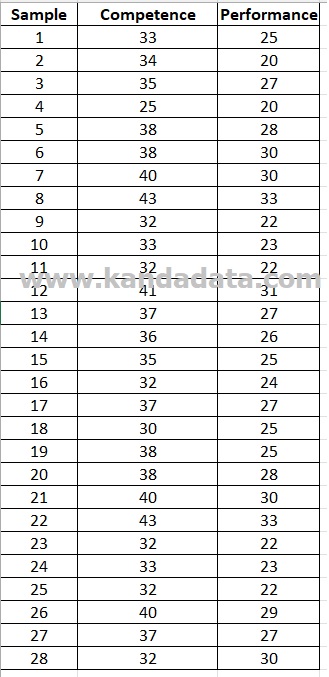
The study used cross-sectional data from 28 farmers of broiler chickens in an area. The competency variable is represented by nine items of the Likert scale statement, and seven items of Likert scale statement represent the performance variable.
The Total Score of statement items from competency and performance variables for 28 samples can be seen in the table below:
Choosing a Correlation Analysis Technique
Based on what I wrote in the previous paragraph, the correlation analysis in the research example above is a partial correlation. Following the research objective to determine the relationship between competence and performance, we can know that the measured variables are non-parametric variables with an ordinal scale.
Because both competency and performance variables are measured using a Likert scale (ordinal scale), Spearman rank correlation analysis was chosen. Based on the Spearman rank correlation analysis, we can find out whether the relationship between variables is significant or not. In addition, we can also obtain information on the close relationship and sign of the relationship between competence and performance.
Spearman Rank Correlation Analysis using SPSS
Spearman rank correlation analysis can be analyzed using statistical software or manually calculated. I will give an example of analyzing the Spearman rank correlation using SPSS.
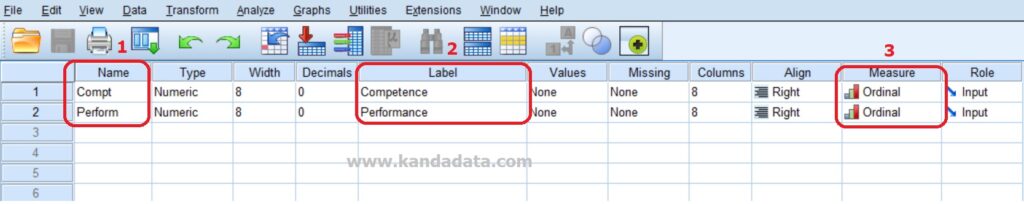
In the first step before data input, we need to do the settings in the “variable view” window in SPSS. At this stage, the fields that need to be filled are Name, Label, and Measure. Other columns can follow the default settings from SPSS.
The name column is filled with the name of the variable. Here for the competence variable, I write “Compt” and for the performance variable, I write “Perform” Next, for the label column, I write Competence and Performance, respectively. Then, in the measure column, “Ordinal” is selected because both competence and performance variables are measured on an ordinal scale. More detail can be seen in the image below:
In the next step, you can input one by one each of the data that has been collected. Alternatively, you can also copy-paste data from Excel if you have previously inputted it in Excel. The data display that has been inputted into the “Data View” window can be seen in the image below:

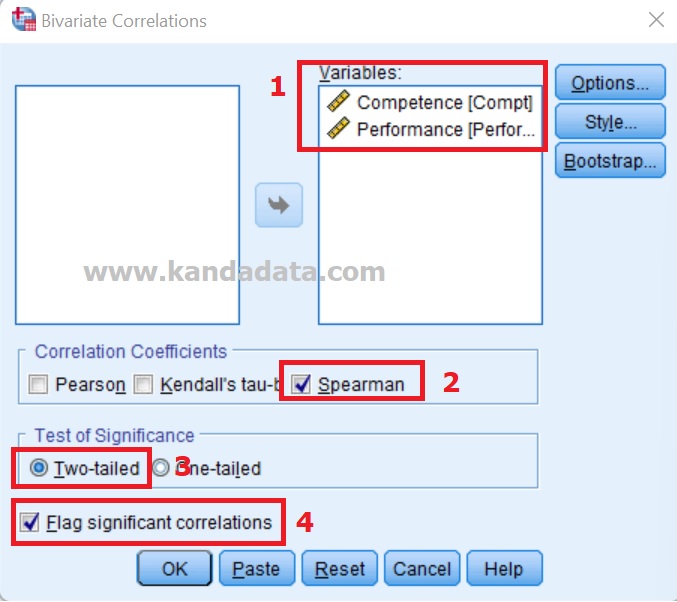
To start analyzing in SPSS, click Analyze -> Correlate -> Bivariate. Then the “Bivariate Correlations” window will appear. The next step is to move the competency and performance variables from the left box to the right box.
In the correlation coefficient option, you select Spearman. Next, for the test of significance, choose Two-Tailed. You can enable the significant correlations flag so that if the correlation is significant, there will be an asterisk in the SPSS output. For more details, see the image below:
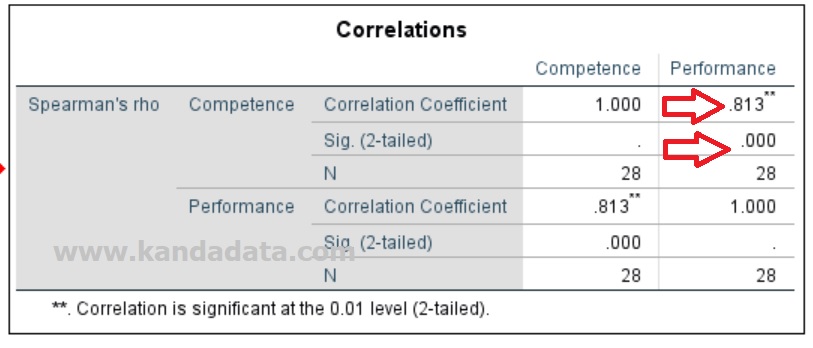
After you click Ok, the output will appear in a new window. The output of competency and performance correlation analysis using SPSS can be seen in the image below:
Spearman Rank Correlation Output Interpretation
Based on the output of the Spearman rank correlation analysis, we can prove whether our hypothesis is accepted or rejected. In addition, based on the value of the correlation coefficient, the relationship’s closeness and the sign of the relationship can be seen.
The purpose of the study is to determine the relationship between farmer competence and the performance of the broiler chicken business. To make it easier, we need to formulate a hypothesis. The statistical hypothesis created consists of a null hypothesis and an alternative hypothesis.
For example, the hypothesis created is as follows:
H0: Farmer competency has no significant relationship with broiler business performance.
Ha: Farmer’s competence has a significant relationship with broiler business performance.
To test the hypothesis, you can use two ways: comparing the correlation coefficient with the r table and looking at the p-value alpha. Based on the SPSS output, the p-value alpha (sig.) has been obtained.
The criteria for acceptance or rejection of the hypothesis are:
P-value > 0.05, then the null hypothesis is accepted.
P-value <= 0.05, then the null hypothesis is rejected (alternative hypothesis is accepted).
Based on the SPSS output, it is known that the value of sig. of .000 indicates that the p-value <0.05. Thus, the null hypothesis is rejected, or the alternative hypothesis is accepted. Therefore, it can be concluded that farmer competence has a significant relationship with broiler business performance.
Suppose the greater of the correlation coefficient (the closer to one) indicate the stronger the relationship between the variables. In addition, based on a correlation coefficient of 0.813, it shows a strong relationship. Therefore, it can also be concluded that competence and performance have a strong relationship.
Furthermore, the correlation coefficient’s sign can be interpreted as whether it has a unidirectional or an opposite relationship. If the sign is positive, it has a unidirectional relationship. On the other hand, if the sign is negative, it means that it has the opposite relationship.
Based on the SPSS output, the sign of the correlation coefficient is positive. This interpretation can be analogous to if the competence of breeders is increased, it will improve the performance of the broiler business. Thus it can be concluded that competence and performance have a unidirectional relationship.
For a deeper understanding of nonparametric approaches, which are often suitable for analyzing ordinal data like Likert scales, I recommend the book Nonparametric Statistical Methods, 3rd Edition. It provides comprehensive insights into methods and applications for nonparametric analysis.
Closing Remark
Based on what has been written in the previous paragraphs, we have learned many things. Firstly, we can use a Likert scale when the variable being measured is on an ordinal scale. Secondly, correlation analysis for variables measured using a Likert scale can use Spearman rank correlation.
Thirdly, interpreting the results of the Spearman rank correlation analysis includes hypothesis testing, closeness, and sign correlation. Well, that’s all I can write for all of you. Please feel free to look forward to the following article update!