Blog
Descriptive Statistics Analysis in Excel: A Step-by-Step Guide for Researcher

Descriptive statistics analysis is a crucial step in research, aimed at summarizing and illustrating fundamental information from a dataset. Through descriptive statistics, we can present data in a more informative and easily understandable format.
This analysis helps identify patterns, trends, and characteristics within the data, making it essential to understand the data type, as the analytical methods employed vary accordingly.
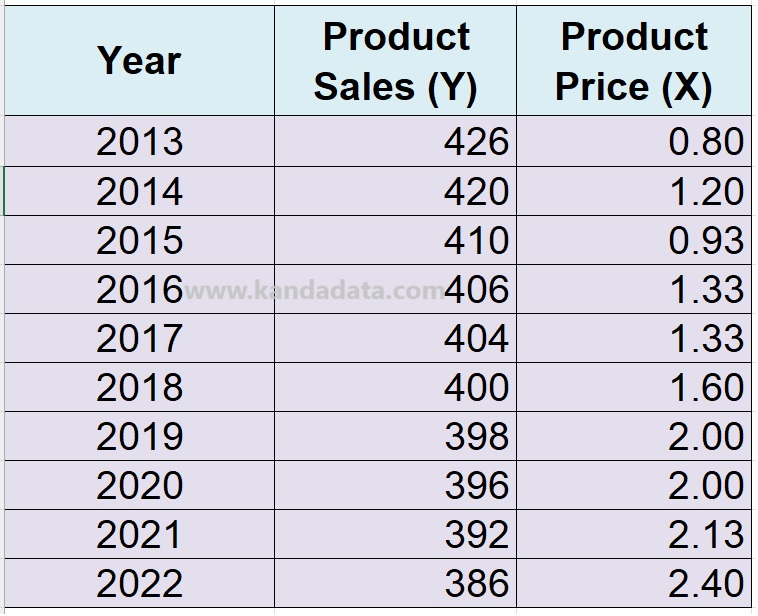
In this tutorial, I will guide you through the process of performing descriptive statistics analysis using Microsoft Excel for data can be seen below:
Before utilizing the data analysis menu in Excel, ensure that the ‘Analysis ToolPak’ add-in is activated. If not, activate it by following the instructions in a previous article.
How to Access the Data Analysis Menu in Excel
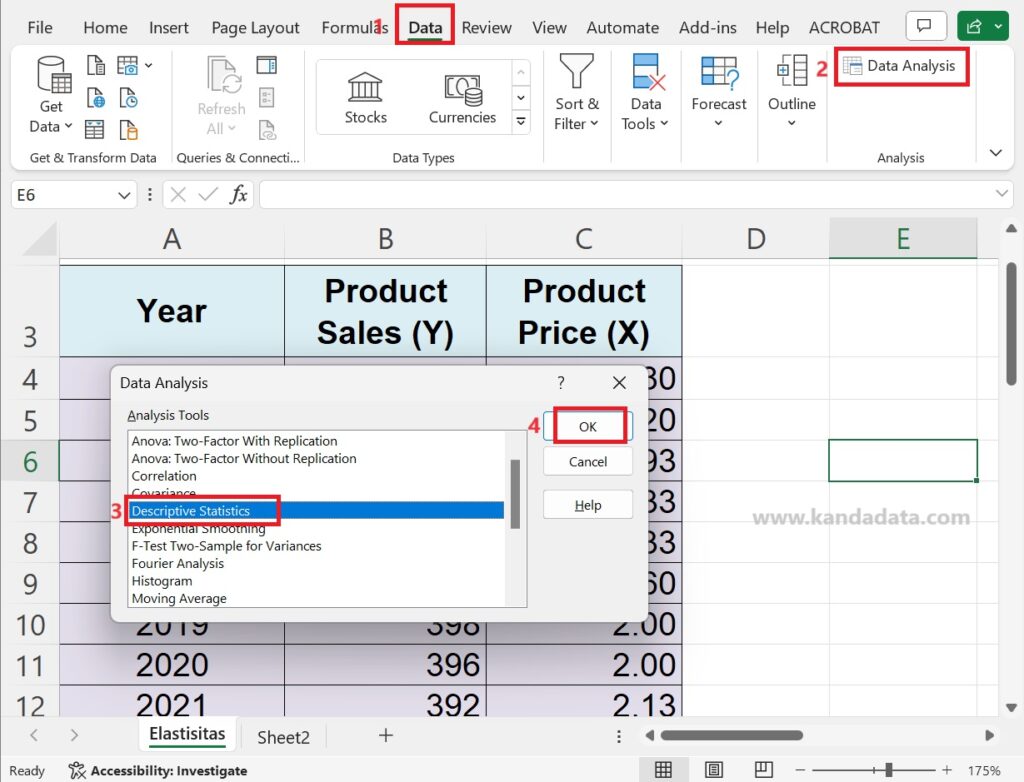
Open your Excel file and click on the ‘Data’ tab in the Ribbon. A data analysis menu will appear in the top right and then select ‘Descriptive Statistics’ as shown in the image below:
Step-by-Step Guide for Descriptive Statistics Analysis
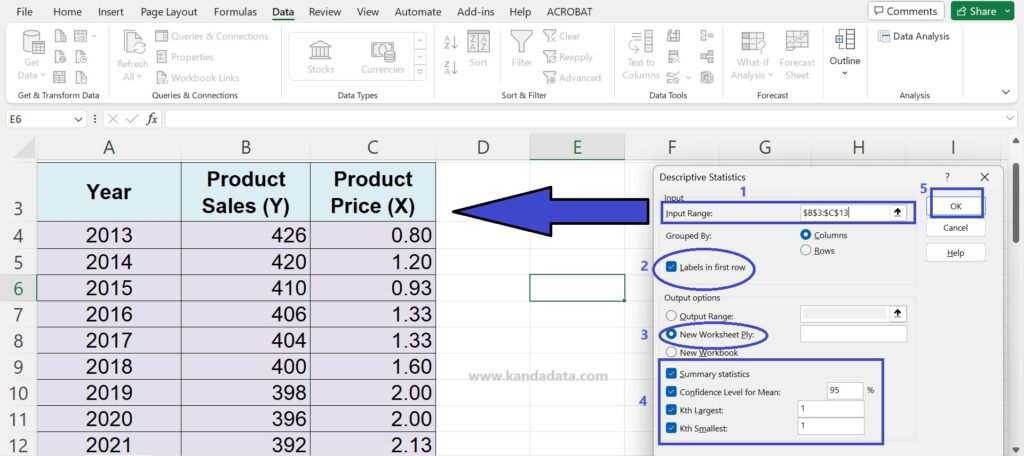
To input variables such as Product Sales (Y) and Product Price (X) into Excel, click the arrow as shown in the picture below. For the ‘Input Range,’ select the data range for your variables (Product Sales (Y) and Product Price (X)). In this case, choose cells B3:C13.
Choose ‘Labels in first row’ if your data has column headers as variable labels. Select the output location where you want the descriptive statistics analysis results to appear. For instance, I want to store the results on a sheet named Sheet1.
Activate ‘Summary Statistics’ and ‘Confidence Level for Means 95%.’ You can also activate ‘Kth Largest’ and ‘Kth Smallest’ if needed. Detailed steps for the descriptive statistics analysis can be seen in the image below:
Descriptive Statistics Analysis Output
Once these steps are completed, click ‘Ok.’ The output of the descriptive statistics analysis will then appear, providing a detailed overview of the analysis for both Product Sales (Y) and Product Price (X) variables:
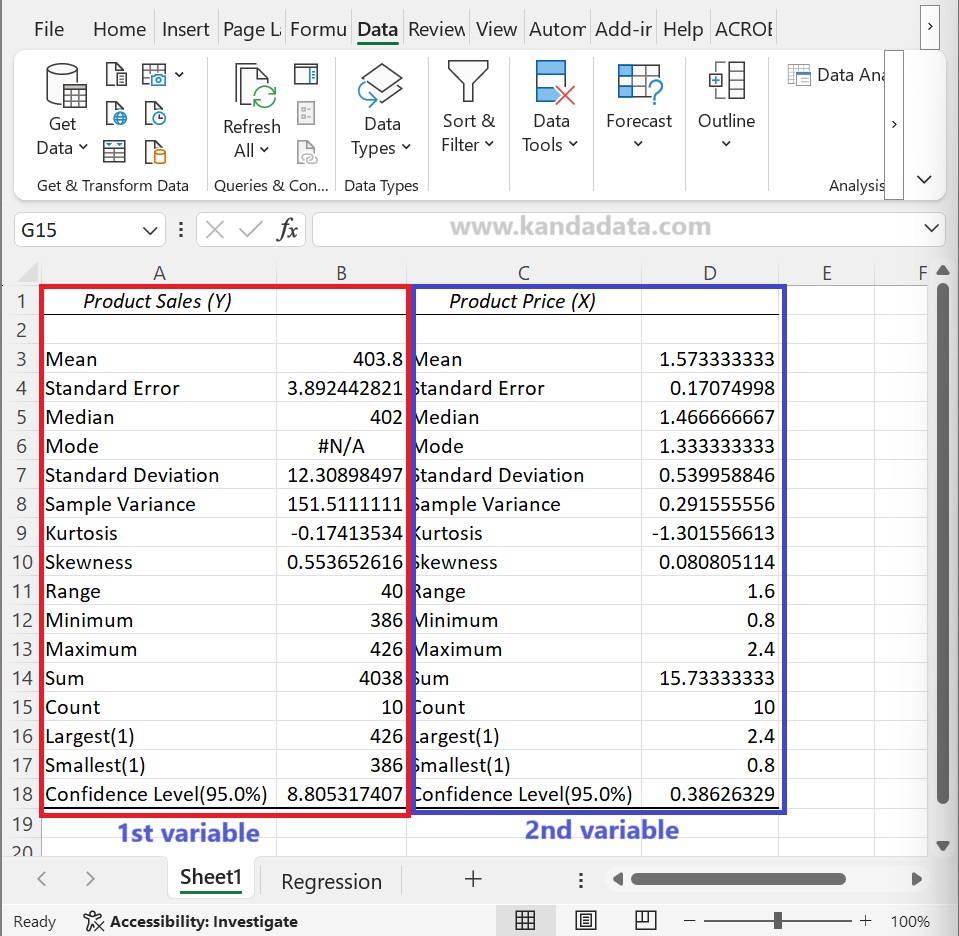
Based on the output, you can interpret the results, focusing on measures of central tendency and data spread. The Excel output covers values such as mean, standard error, median, mode, standard deviation, sample variance, kurtosis, skewness, range, maximum, minimum, sum, count, largest value, and smallest value.
This tutorial provides a comprehensive guide on performing descriptive statistics analysis using Excel. I hope this step-by-step article proves helpful to those seeking to conduct descriptive statistics analysis with Excel. Stay tuned for more updates from Kanda Data in the upcoming week.