Blog
How to Calculate the Regression Coefficient of 4 Independent Variables in Multiple Linear Regression

A multiple linear regression includes at least two independent variables and one dependent variable. In some previous articles, I’ve written about manually calculating multiple linear regression with two and three independent variables.
For a tutorial on calculating regression coefficients with two independent variables, you can read my previous article: “Finding Coefficients bo, b1, b2, and R Squared Manually in Multiple Linear Regression“. Furthermore, for a tutorial on how to calculate regression coefficients with three independent variables, you can read the article entitled: “Calculate Coefficients bo, b1, b2, and b3 Manually (3 Independent Variables) in Multiple Linear Regression“
The estimated coefficient of multiple linear regression is crucial for researchers to comprehend. Thus, on this occasion, “Kanda Data” will write a follow-up article about a tutorial on manually computing multiple linear regression with four independent variables using Excel.
Compared to multiple linear regression with 2 or 3 independent variables, multiple linear regression with four independent variables has a different formula. The estimated regression coefficient value in a multiple linear regression with four independent variables can be calculated using various techniques. This time, I’ll guide you through how to estimate a regression coefficient using a matrix technique.
Case study for exercise
This mini-study aims to determine how four independent variables affect one dependent variable. This study specifically aims to discover the impact of operational costs, marketing staff, sales incentives, and store location on product sales. I have 15 quarterly time series data provided as exercise material.
The specifications of the regression equation from this mini-research are:
Y = b0 + b1X1 + b2X2 + b3X3 + b4X4 + e
where,
Y = Product sales
X1 = Operational cost
X2 = Marketing staff
X3 = Sales incentives
X4 = Store location
b0 = Intercept
b1, b2, b3, b4 = regression estimation coefficient
e = Error term
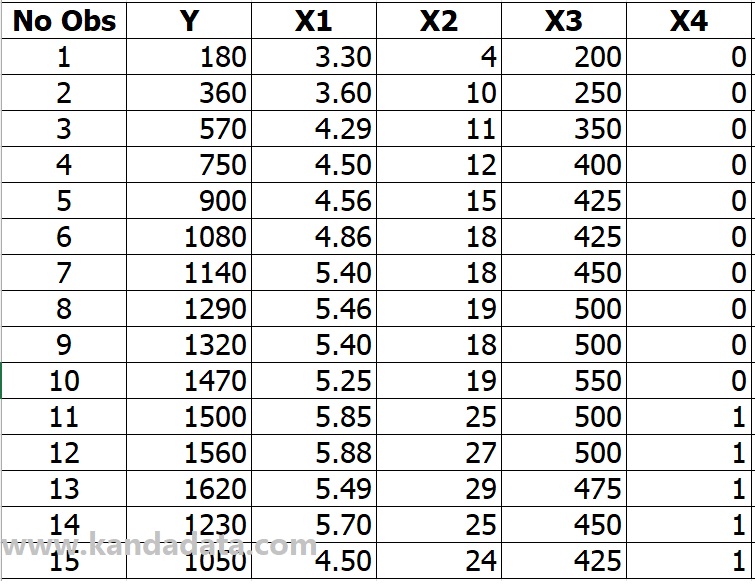
Time series data were collected by researchers from the first to the fifteenth quarters, with the details of the data collecting results as follows:
The formula using the matrix approach
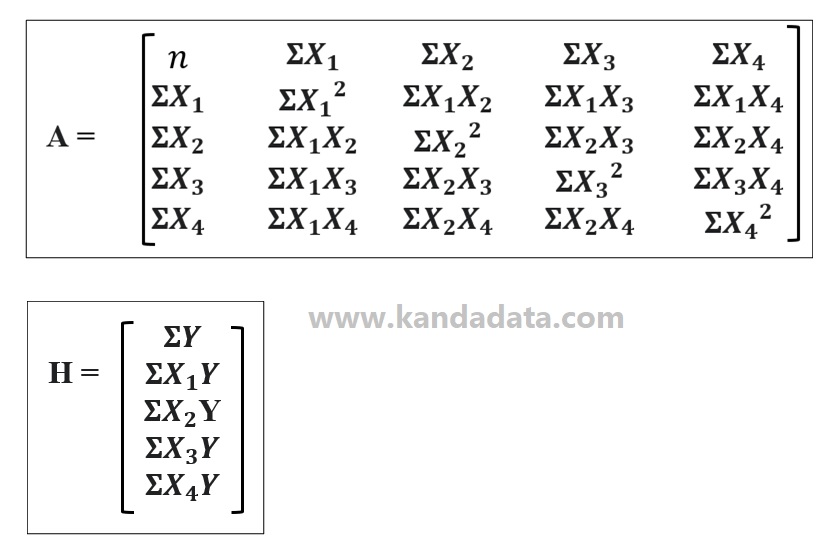
Based on what I stated in the preceding paragraph, I will compute the estimated coefficient values of b0, b1, b2, b3, and b4 using a matrix approach. I’m using matrix A and matrix H in this case. Order 4 * 1 is used in matrix H, while order 4 * 4 is used in matrix A. The matrix components used on this occasion can be observed as follows in further detail:
Formula Templates in Excel
I’ll use Excel to simplify the calculations once we’ve learned and use the matrix approach to determine the estimated regression coefficient. I use Excel to optimize computations and reduce human error when performing manual calculations.
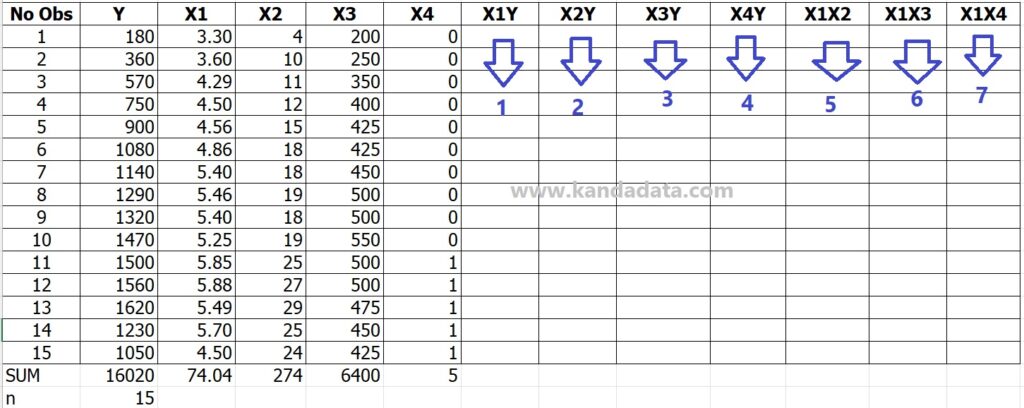
I’ll add other Excel columns based on the A matrix elements and the H matrix. To accommodate the needs of the components in matrices A and H, I added 14 extra columns to the Excel template I used to calculate the estimated regression coefficients.
I added extra Excel columns per the matrix’s equation to prevent calculating mistakes. I numbered and inserted arrows in the Excel template from 1 to 14. The picture below shows the Excel template I use to compute regression estimates using a matrix approach in more detail:

Manual Calculations Using Formula Templates in Excel
Creating a manual calculation template using Excel is the following step after that. Since Excel is being used, we can use its formulas to determine each matrix component in the Excel column.
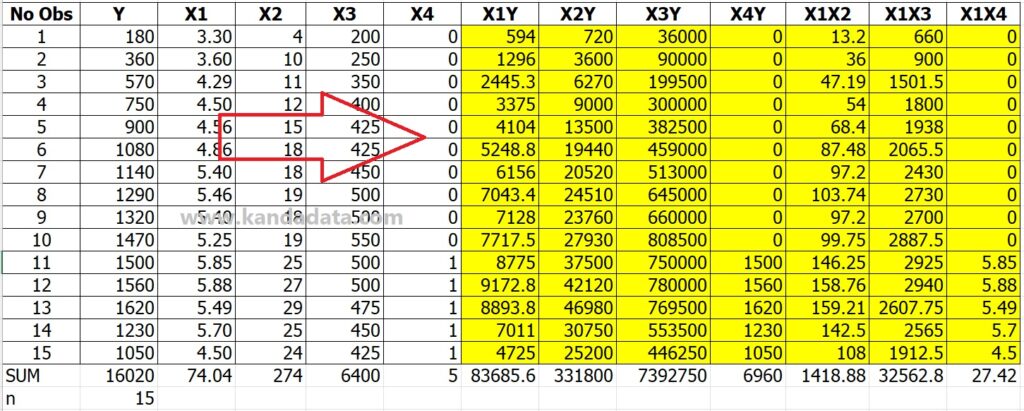
The formula for each matrix element must be followed mathematical operations. We manually compute the result from the first to the fourteenth column.
The next step is to add each column, starting with the actual data and ending with the column used to calculate the matrix element. The table below shows the results of the matrix template’s calculation:

The formula for calculating the regression estimation coefficient
The intercept and estimate regression coefficients are calculated once each matrix element uses the Excel formula template. We must determine the determinant of the formula matrix to calculate the regression coefficient. The image below shows how to determine the matrix’s determinants:
You can determine the value of the determinant using the method above, starting with the determinants A, H, A1, A2, A3, A4, and A5. We can use Excel formulas to determine the determinant.
However, we must create supplementary tables based on the components of matrices A and H. The next step is to complete each matrix element using an Excel template and the results of the calculations. The following details results derived from the calculations on the A, H, A1, A2, A3, A4, and A5 matrices:

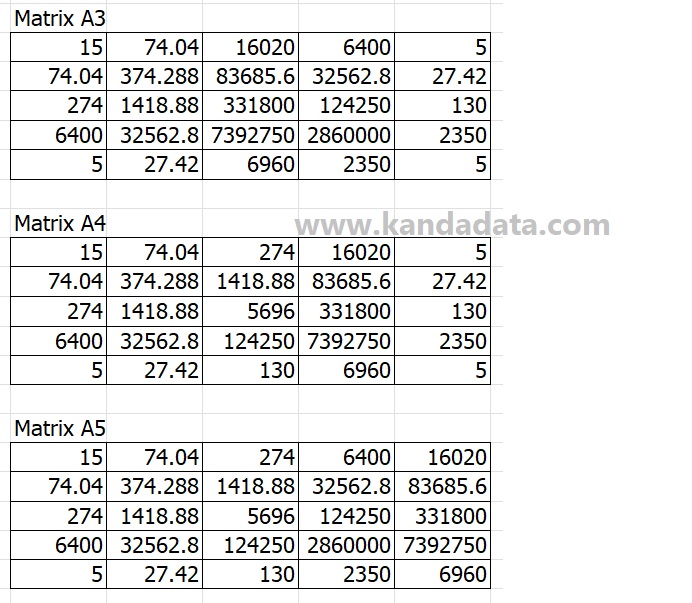
The value of the determinant is determined after the matrix elements have been arranged, as in the image above. You can use the formula = MDETERM(…) to determine the determinant.
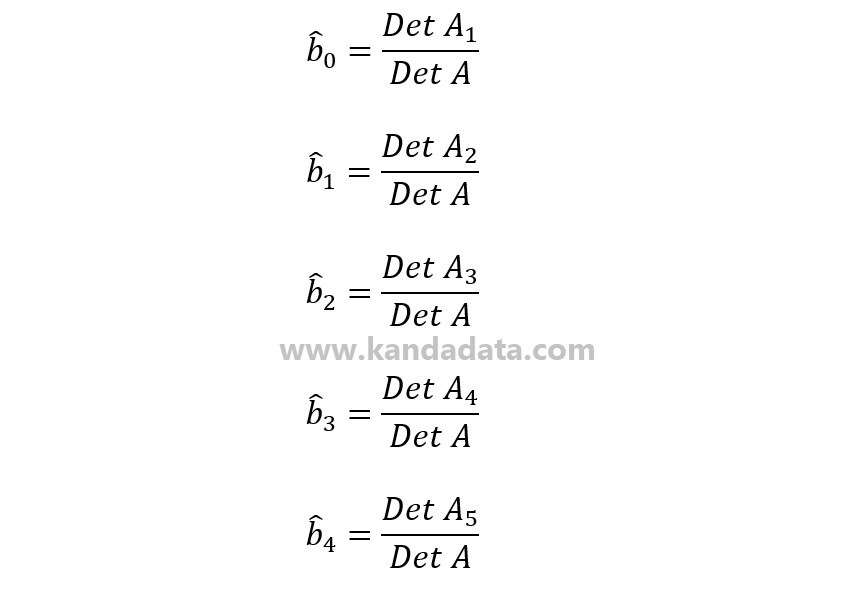
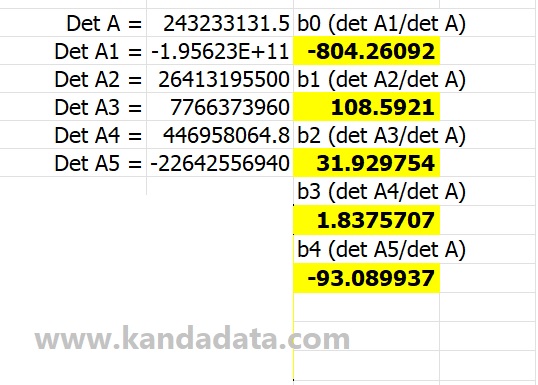
The next step is to block every matrix element. You will then be given the matrix’s determinant value. The coefficients of bo, b1, b2, b3, and b4 must then be calculated using the formula I have provided above. The figure below shows the final results of the complete regression coefficient calculations:
Recheck Manual Calculation
We may compare the results of our manual calculations to the output of the statistical program to ensure they are accurate. Numerous tools, like SPSS, SAS, STATA, and others, are available. On this occasion, I’ll use data analysis toolpak in Excel.
I should take into account the fact that I’ve always used Excel for manual calculations. You will need to enable the data analysis toolpak if you can’t find the data analysis menu in Excel. The following figure shows the analysis’s result in Excel using four independent variables for multiple linear regression:
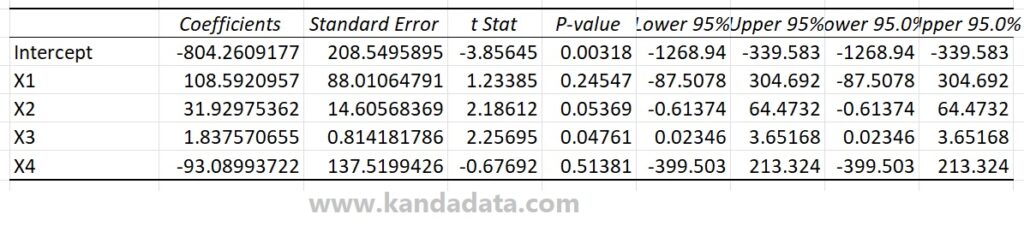
Using Excel, I retrieved a part of the analysis output, which showed the coefficients of bo, b1, b2, b3, and b4, based on the image above. We already knew that the results were the same since we had compared the output of the data analysis toolpak in Excel to the results of manual computations. As a result, we can conclude that the findings of our manual computations are accurate. Want to enhance your regression analysis skills using Excel? Check out Regression Analysis: Understanding and Building Business and Economic Models Using Excel here. Thank you!